Gene Information
|
Gene Name
|
CD200 |
|
Gene ID
|
4345
|
|
Gene Full Name
|
CD200 molecule |
|
Gene Alias
|
MOX1|MOX2|MRC|OX-2 |
|
Transcripts
|
ENSG00000091972
|
|
Virus
|
HTLV1 |
|
Gene Type
|
protein-coding |
|
HPA Location Info
|

|
|
Membrane Info
|
CD markers, Predicted intracellular proteins, Predicted membrane proteins |
|
Uniport_ID
|
P41217
|
|
HGNC ID
|
HGNC:7203
|
|
OMIM ID
|
155970 |
|
Summary
|
This gene encodes a type I membrane glycoprotein containing two extracellular immunoglobulin domains, a transmembrane and a cytoplasmic domain. This gene is expressed by various cell types, including B cells, a subset of T cells, thymocytes, endothelial cells, and neurons. The encoded protein plays an important role in immunosuppression and regulation of anti-tumor activity. Alternative splicing results in multiple transcript variants encoding different isoforms. [provided by RefSeq, Jan 2016] |
Target gene [CD200] related to VISs 
Integration Table: if previous studies reported that target gene was altered by virus integration events, the overlap between VISs in this literature and Cistrome factors was listed in this section
| DVID |
Chromosome |
HM |
TFBS |
CA |
Sum of Overlapped Records |
Detail |
| 6002730 |
chr3 |
208 |
3 |
1 |
212 |
View |
Target gene [CD200] related to Omics data
| Data ID |
Experiment type |
Sample number |
Platform |
|
GSE189602
|
Methylation profiling (Array) |
4 |
Infinium MethylationEPIC |
|
C GSE94732
|
Chip-seq |
24 |
Illumina NextSeq 500 (Homo sapiens);illumina Genome Analyzer IIx (Homo sapiens) |
|
GSE52244
|
Expression array |
15 |
[HuEx-1_0-st] Affymetrix Human Exon 1.0 ST Array [probe set (exon) version] |
|
GSE19080
|
Expression array |
38 |
Homo sapiens 3K Immunoarray2 HTLV-1 JH |
|
GSE10789
|
Expression array |
6 |
NCI/ATC Hs-OperonV3 |
|
GSE224047
|
RNA-seq |
10 |
Illumina NextSeq 500 (Homo sapiens) |
|
GSE168557
|
Expression array |
6 |
Agilent-039494 SurePrint G3 Human GE v2 8x60K Microarray 039381 (Feature Number version) |
|
GSE136189
|
Methylation profiling (Array) |
40 |
Illumina HumanMethylation450 BeadChip (HumanMethylation450_15017482);Illumina Infinium HumanMethylation850 BeadChip |
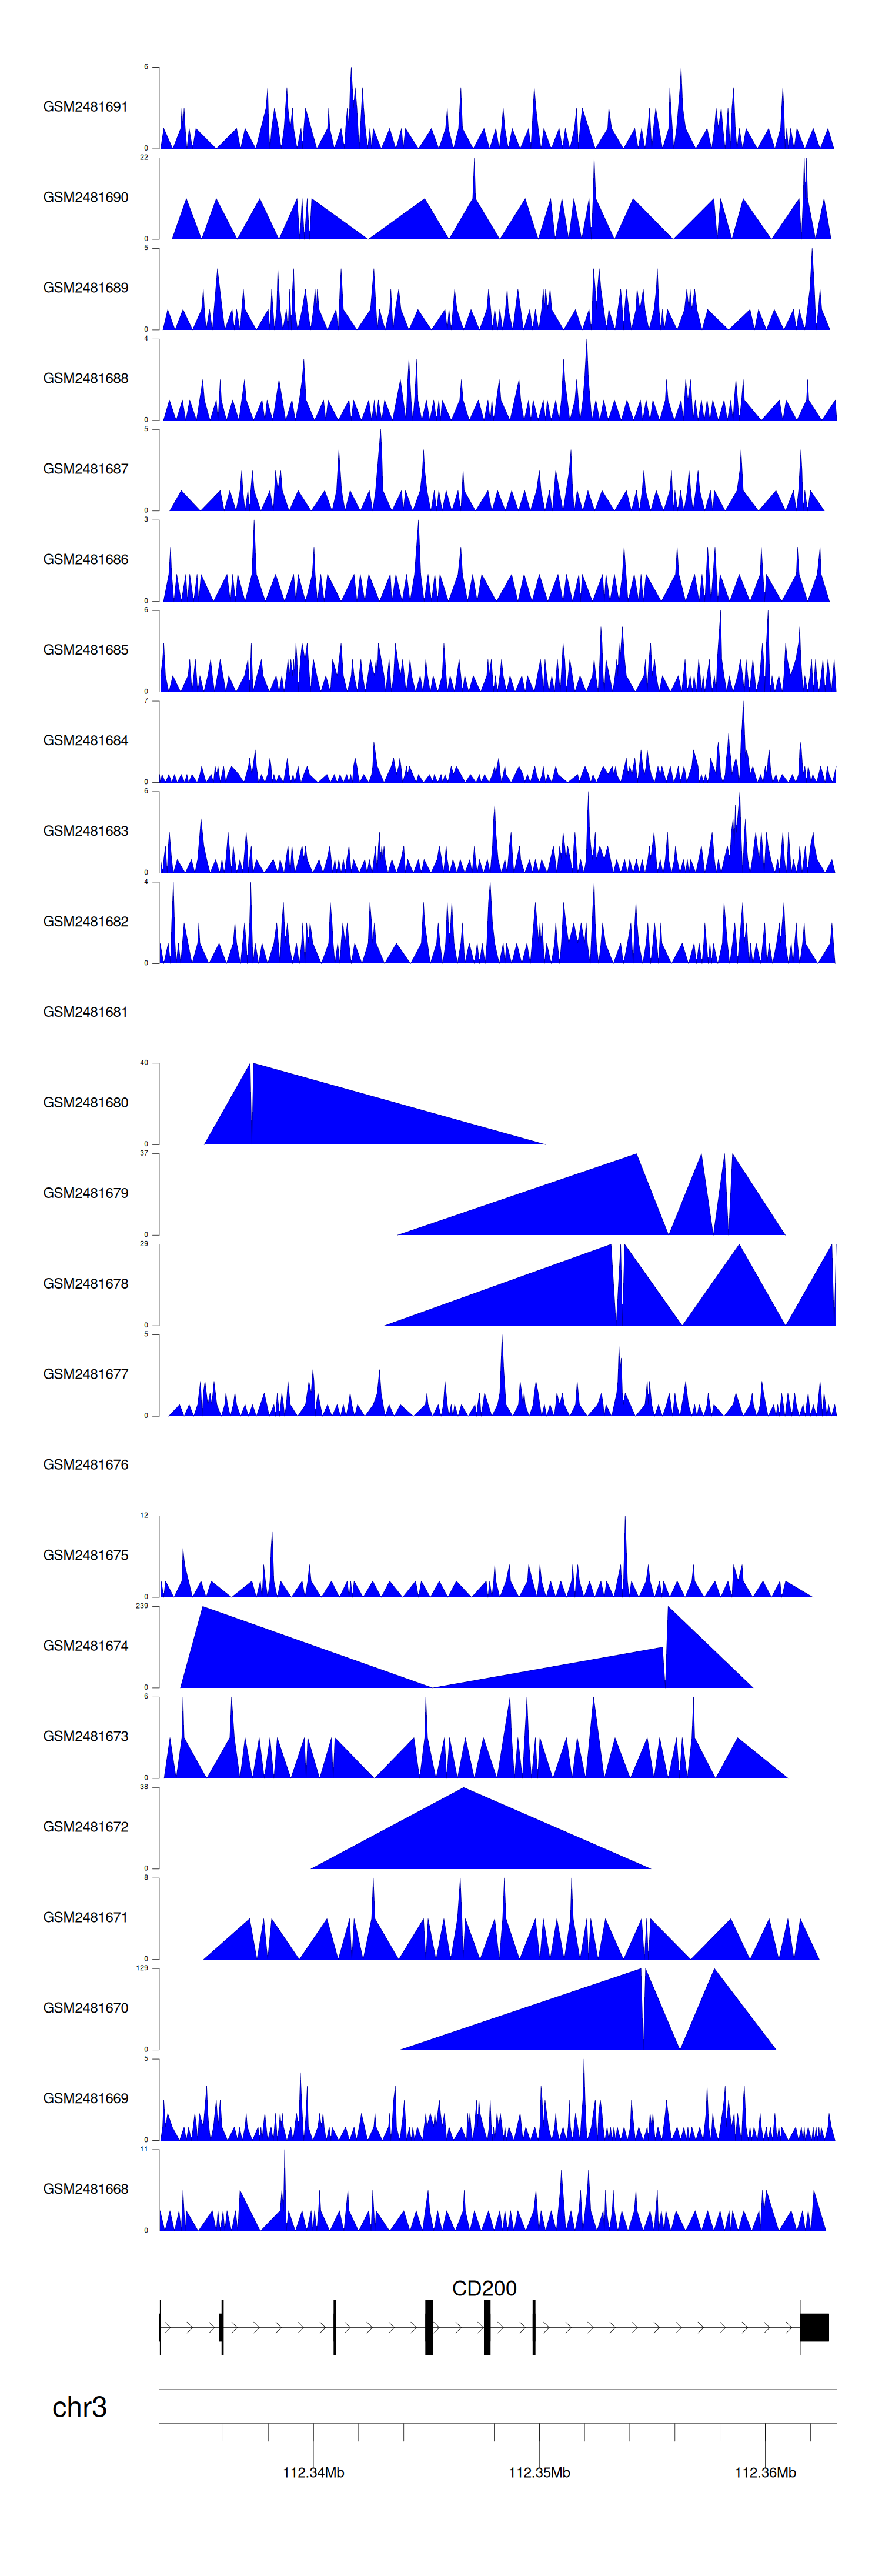
When the gene can detect a peak in the dataset, a peak plot will be displayed.
> Dataset: GSE94732 - CD200 peak across samples
|
Peak Plot
|
|
|
