Gene Information
|
Gene Name
|
CD59 |
|
Gene ID
|
966
|
|
Gene Full Name
|
CD59 molecule (CD59 blood group) |
|
Gene Alias
|
16.3A5|1F5|EJ16|EJ30|EL32|G344|HRF-20|HRF20|MAC-IP|MACIF|MEM43|MIC11|MIN1|MIN2|MIN3|MIRL|MSK21|p18-20 |
|
Transcripts
|
ENSG00000085063
|
|
Virus
|
HBV |
|
Gene Type
|
protein-coding |
|
HPA Location Info
|
Golgi apparatus, Vesicles;Intracellular and membrane; 
|
|
Membrane Info
|
Cancer-related genes, CD markers, Disease related genes, Human disease related genes, Plasma proteins, Predicted intracellular proteins, Predicted membrane proteins |
|
Uniport_ID
|
P13987
|
|
HGNC ID
|
HGNC:1689
|
|
OMIM ID
|
107271 |
|
Summary
|
This gene encodes a cell surface glycoprotein that regulates complement-mediated cell lysis, and it is involved in lymphocyte signal transduction. This protein is a potent inhibitor of the complement membrane attack complex, whereby it binds complement C8 and/or C9 during the assembly of this complex, thereby inhibiting the incorporation of multiple copies of C9 into the complex, which is necessary for osmolytic pore formation. This protein also plays a role in signal transduction pathways in the activation of T cells. Mutations in this gene cause CD59 deficiency, a disease resulting in hemolytic anemia and thrombosis, and which causes cerebral infarction. Multiple alternatively spliced transcript variants, which encode the same protein, have been identified for this gene. [provided by RefSeq, Jul 2008] |
Target gene [CD59] related to VISs 
Integration Table: if previous studies reported that target gene was altered by virus integration events, the overlap between VISs in this literature and Cistrome factors was listed in this section
| DVID |
Chromosome |
HM |
TFBS |
CA |
Sum of Overlapped Records |
Detail |
| 1041874 |
chr11 |
258 |
18 |
35 |
311 |
View |
Target gene [CD59] related to Omics data
| Data ID |
Experiment type |
Sample number |
Platform |
|
S GSE252863
|
scRNA-seq |
10 |
Illumina HiSeq 2500 (Homo sapiens) |
|
GSE236281
|
RNA-seq |
12 |
Illumina MiSeq (Homo sapiens) |
|
C GSE35465
|
Chip-seq;RNA-seq |
6 |
Illumina HiSeq 2000 (Homo sapiens) |
|
S GSE199850
|
scRNA-seq |
1 |
HiSeq X Ten (Homo sapiens) |
|
C GSE68402
|
Chip-seq |
26 |
Illumina MiSeq (Homo sapiens);Illumina HiSeq 2500 (Homo sapiens) |
|
GSE247322
|
scRNA-seq |
27 |
Illumina NovaSeq 6000 (Homo sapiens) |
|
TCGA_LIHC_HBV
|
DNA methylation sequencing;RNA-seq |
97 |
TCGA |
|
C GSE270130
|
Chip-seq |
27 |
Illumina NovaSeq 6000 (Homo sapiens) |
|
GSE224901
|
RNA-seq |
21 |
Illumina NovaSeq 6000 (Homo sapiens) |
|
E GSE100400
|
Chip-seq;RNA-seq;4C_cccDNA |
31 |
Illumina NextSeq 500 (Homo sapiens);Illumina NextSeq 500 (Mus musculus) |
|
GSE173897
|
RNA-seq |
95 |
Illumina HiSeq 4000 (Homo sapiens) |
|
GSE262515
|
RNA-seq |
21 |
Illumina HiSeq 2500 (Homo sapiens);Illumina HiSeq 2500 (Mus musculus) |
|
GSE110345
|
RNA-seq |
4 |
Illumina HiSeq 2500 (Homo sapiens) |
|
C GSE131257
|
ATAC-seq;RNA-seq |
19 |
Illumina HiSeq 2500 (Homo sapiens) |
|
GSE94660
|
RNA-seq |
42 |
Illumina HiSeq 2500 (Homo sapiens) |
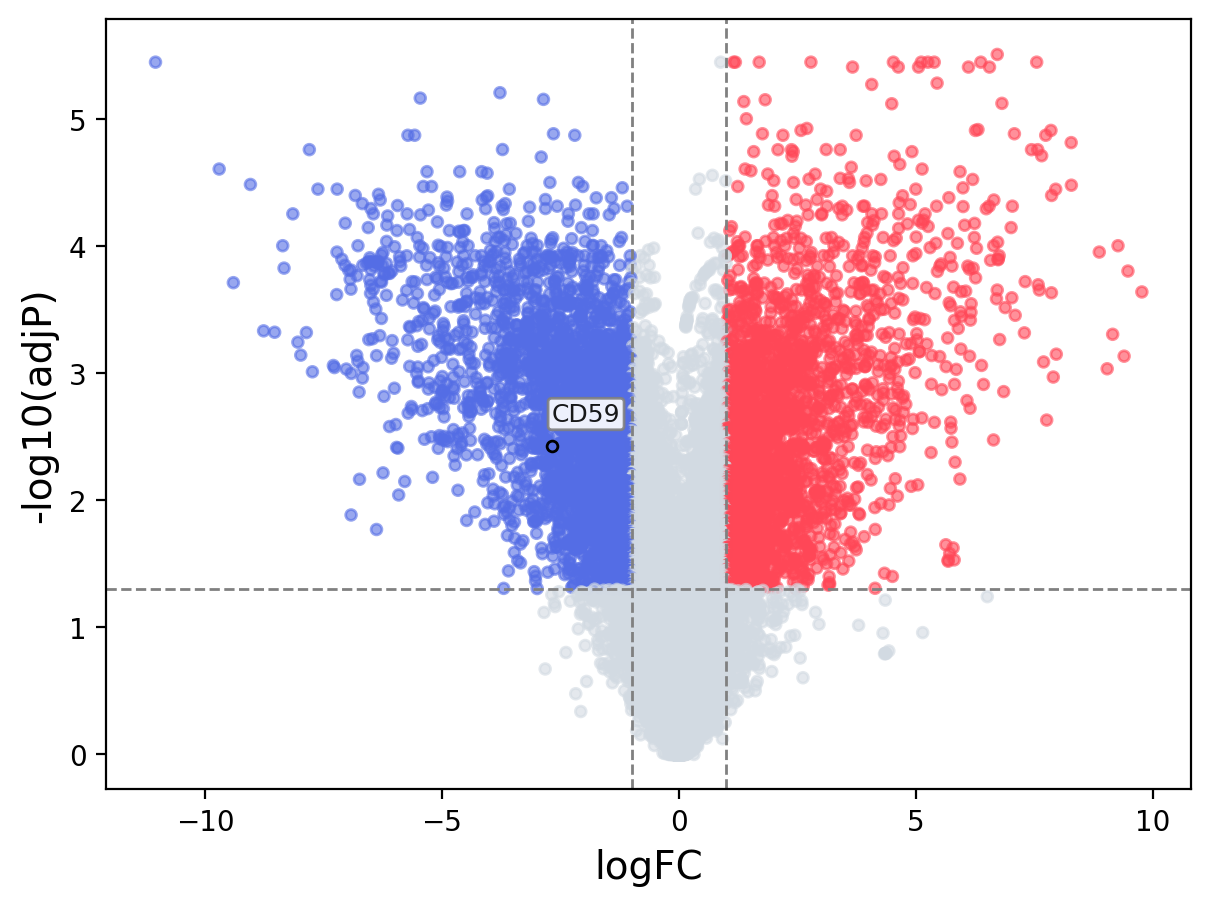
When the query gene is differentially changed in the dataset, a volcano/bar plot will be displayed.
> Dataset: GSE100400 - CD59 expression across samples
|
Volcano Plot
|
Bar Plot
|
|
|
