Gene Information
|
Gene Name
|
DIAPH2 |
|
Gene ID
|
1730
|
|
Gene Full Name
|
diaphanous related formin 2 |
|
Gene Alias
|
DIA|DIA2|DRF2|POF|POF2|POF2A |
|
Transcripts
|
ENSG00000147202
|
|
Virus
|
HTLV1 |
|
Gene Type
|
protein-coding |
|
HPA Location Info
|
Endoplasmic reticulum, Vesicles;Nucleoli; 
|
|
Membrane Info
|
Disease related genes, Human disease related genes, Plasma proteins, Predicted intracellular proteins |
|
Uniport_ID
|
O60879
|
|
HGNC ID
|
HGNC:2877
|
|
OMIM ID
|
300108 |
|
Summary
|
The product of this gene belongs to the diaphanous subfamily of the formin homology family of proteins. This gene may play a role in the development and normal function of the ovaries. Defects in this gene have been linked to premature ovarian failure 2. Alternatively spliced transcript variants encoding different isoforms have been identified. [provided by RefSeq, Jul 2008] |
Target gene [DIAPH2] related to VISs 
Integration Table: if previous studies reported that target gene was altered by virus integration events, the overlap between VISs in this literature and Cistrome factors was listed in this section
Target gene [DIAPH2] related to Omics data
| Data ID |
Experiment type |
Sample number |
Platform |
|
GSE189602
|
Methylation profiling (Array) |
4 |
Infinium MethylationEPIC |
|
C GSE94732
|
Chip-seq |
24 |
Illumina NextSeq 500 (Homo sapiens);illumina Genome Analyzer IIx (Homo sapiens) |
|
GSE52244
|
Expression array |
15 |
[HuEx-1_0-st] Affymetrix Human Exon 1.0 ST Array [probe set (exon) version] |
|
GSE19080
|
Expression array |
38 |
Homo sapiens 3K Immunoarray2 HTLV-1 JH |
|
GSE10789
|
Expression array |
6 |
NCI/ATC Hs-OperonV3 |
|
GSE224047
|
RNA-seq |
10 |
Illumina NextSeq 500 (Homo sapiens) |
|
GSE168557
|
Expression array |
6 |
Agilent-039494 SurePrint G3 Human GE v2 8x60K Microarray 039381 (Feature Number version) |
|
GSE136189
|
Methylation profiling (Array) |
40 |
Illumina HumanMethylation450 BeadChip (HumanMethylation450_15017482);Illumina Infinium HumanMethylation850 BeadChip |
When the gene can detect a peak in the dataset, a peak plot will be displayed.
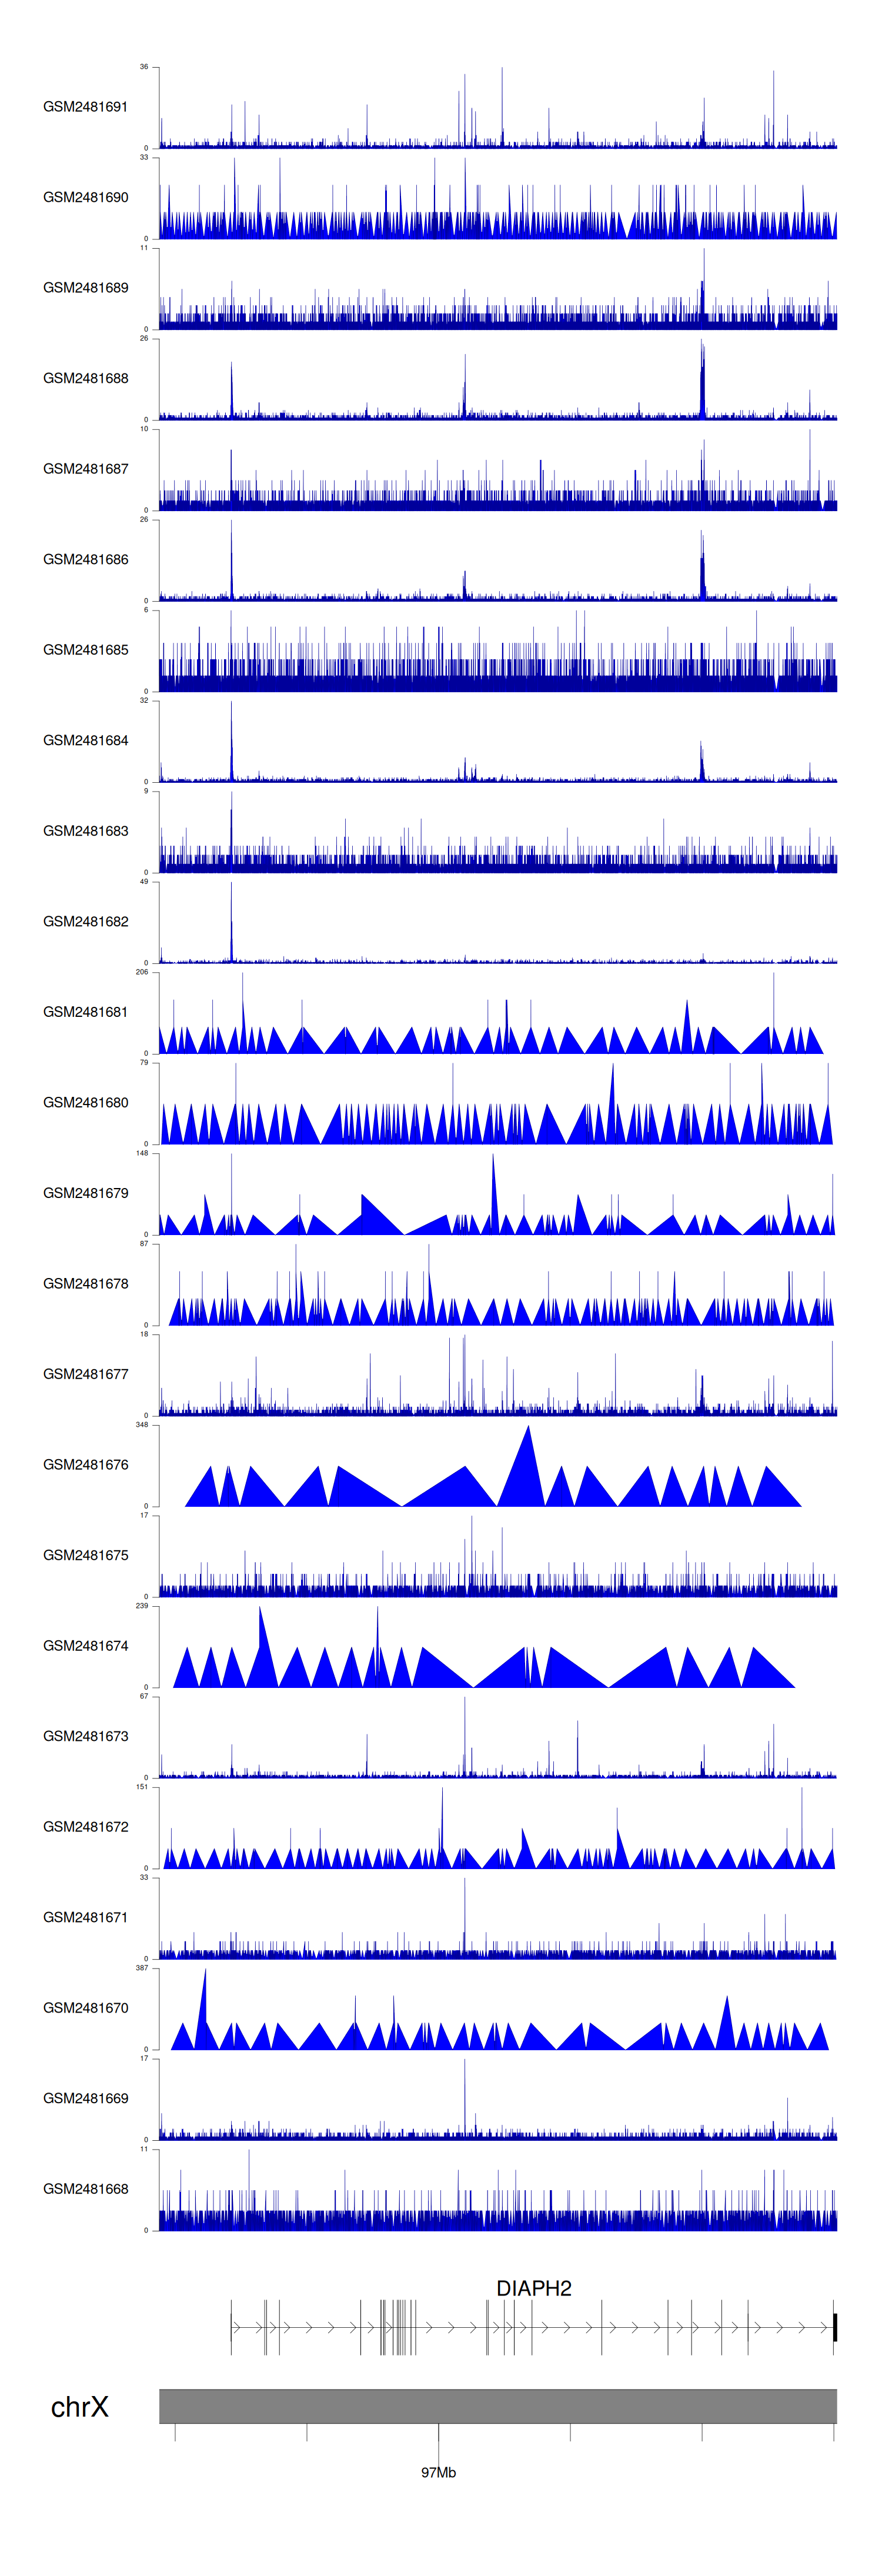
> Dataset: GSE94732 - DIAPH2 peak across samples
|
Peak Plot
|
|
|
