Gene Information
|
Gene Name
|
ENO2 |
|
Gene ID
|
2026
|
|
Gene Full Name
|
enolase 2 |
|
Gene Alias
|
HEL-S-279|NSE |
|
Transcripts
|
ENSG00000111674
|
|
Virus
|
HTLV1 |
|
Gene Type
|
protein-coding |
|
HPA Location Info
|
Plasma membrane, Cytosol; 
|
|
Membrane Info
|
Cancer-related genes, Candidate cardiovascular disease genes, Enzymes, Metabolic proteins, Plasma proteins, Predicted intracellular proteins |
|
Uniport_ID
|
P09104
|
|
HGNC ID
|
HGNC:3353
|
|
OMIM ID
|
131360 |
|
Summary
|
This gene encodes one of the three enolase isoenzymes found in mammals. This isoenzyme, a homodimer, is found in mature neurons and cells of neuronal origin. A switch from alpha enolase to gamma enolase occurs in neural tissue during development in rats and primates. [provided by RefSeq, Jul 2008] |
Target gene [ENO2] related to VISs 
Integration Table: if previous studies reported that target gene was altered by virus integration events, the overlap between VISs in this literature and Cistrome factors was listed in this section
| DVID |
Chromosome |
HM |
TFBS |
CA |
Sum of Overlapped Records |
Detail |
| 6008043 |
chr12 |
42 |
7 |
0 |
49 |
View |
Target gene [ENO2] related to Omics data
| Data ID |
Experiment type |
Sample number |
Platform |
|
GSE189602
|
Methylation profiling (Array) |
4 |
Infinium MethylationEPIC |
|
C GSE94732
|
Chip-seq |
24 |
Illumina NextSeq 500 (Homo sapiens);illumina Genome Analyzer IIx (Homo sapiens) |
|
GSE52244
|
Expression array |
15 |
[HuEx-1_0-st] Affymetrix Human Exon 1.0 ST Array [probe set (exon) version] |
|
GSE19080
|
Expression array |
38 |
Homo sapiens 3K Immunoarray2 HTLV-1 JH |
|
GSE10789
|
Expression array |
6 |
NCI/ATC Hs-OperonV3 |
|
GSE224047
|
RNA-seq |
10 |
Illumina NextSeq 500 (Homo sapiens) |
|
GSE168557
|
Expression array |
6 |
Agilent-039494 SurePrint G3 Human GE v2 8x60K Microarray 039381 (Feature Number version) |
|
GSE136189
|
Methylation profiling (Array) |
40 |
Illumina HumanMethylation450 BeadChip (HumanMethylation450_15017482);Illumina Infinium HumanMethylation850 BeadChip |
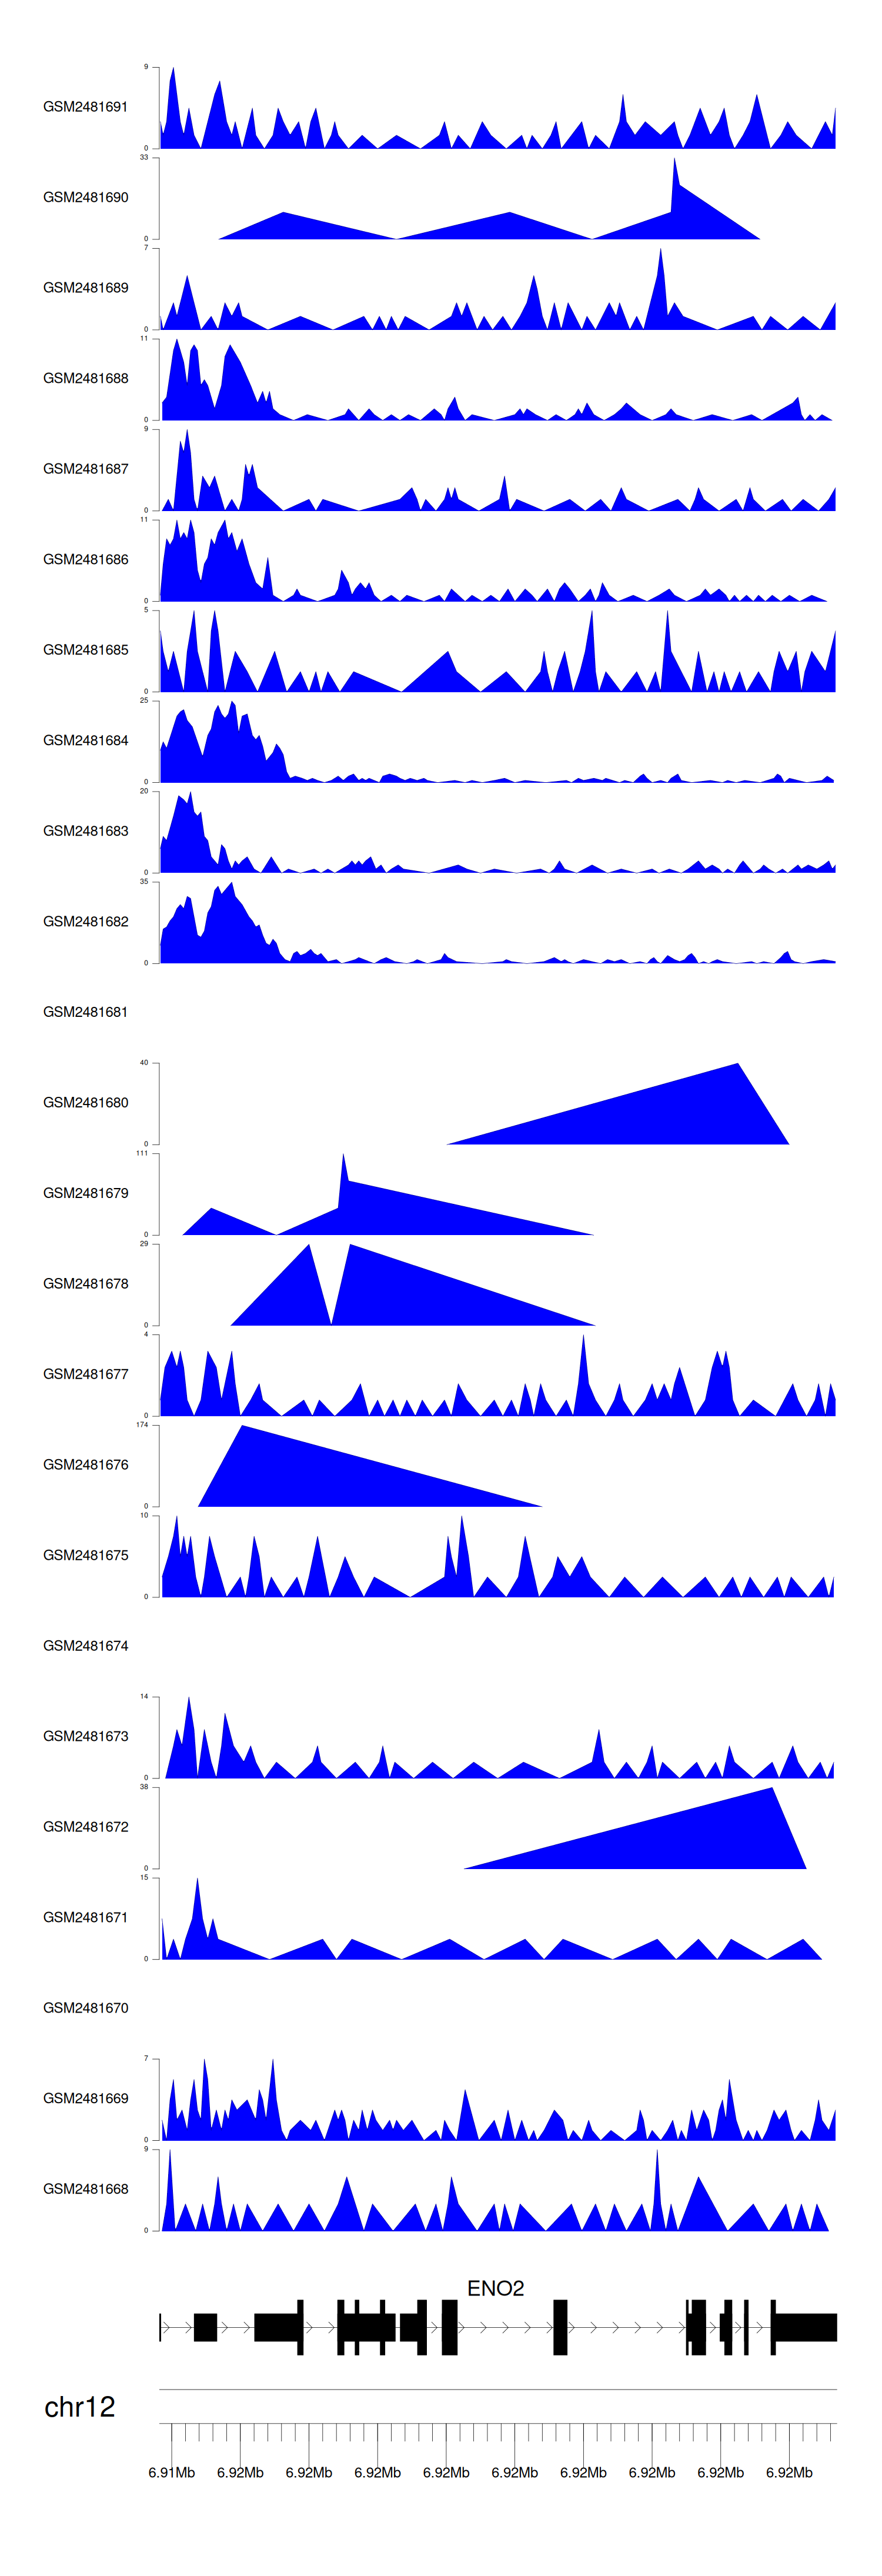
When the gene can detect a peak in the dataset, a peak plot will be displayed.
> Dataset: GSE94732 - ENO2 peak across samples
|
Peak Plot
|
|
|
