HTLV1 Target gene Detail Information

> EPB41L4A Gene Search Result


Gene Information
Gene Name EPB41L4A
Gene ID 64097
Gene Full Name erythrocyte membrane protein band 4.1 like 4A
Gene Alias EPB41L4|NBL4
Transcripts ENSG00000129595
Virus HTLV1
Gene Type protein-coding
HPA Location Info Plasma membrane;Nucleoplasm;
Membrane Info Predicted intracellular proteins
Uniport_ID Q9HCS5
HGNC ID HGNC:13278
OMIM ID 612141
Summary The protein encoded by this gene is a member of the band 4.1 protein superfamily. Members of this superfamily are thought to play an important role in regulating interactions between the cytoskeleton and plasma membrane, and contain an amino terminal conserved domain that binds glycophorin C. This gene product is thought to be involved in the beta-catenin signaling pathway. [provided by RefSeq, Dec 2016]
Target gene [EPB41L4A] related to VISs

Integration Table: if previous studies reported that target gene was altered by virus integration events, the overlap between VISs in this literature and Cistrome factors was listed in this section


DVID Chromosome HM TFBS CA Sum of Overlapped Records Detail
6011377 chr5 8 6 12 26 View
6028924 chr5 0 1 0 1 View

Target gene [EPB41L4A] related to Omics data
Data ID Experiment type Sample number Platform
GSE189602 Methylation profiling (Array) 4 Infinium MethylationEPIC
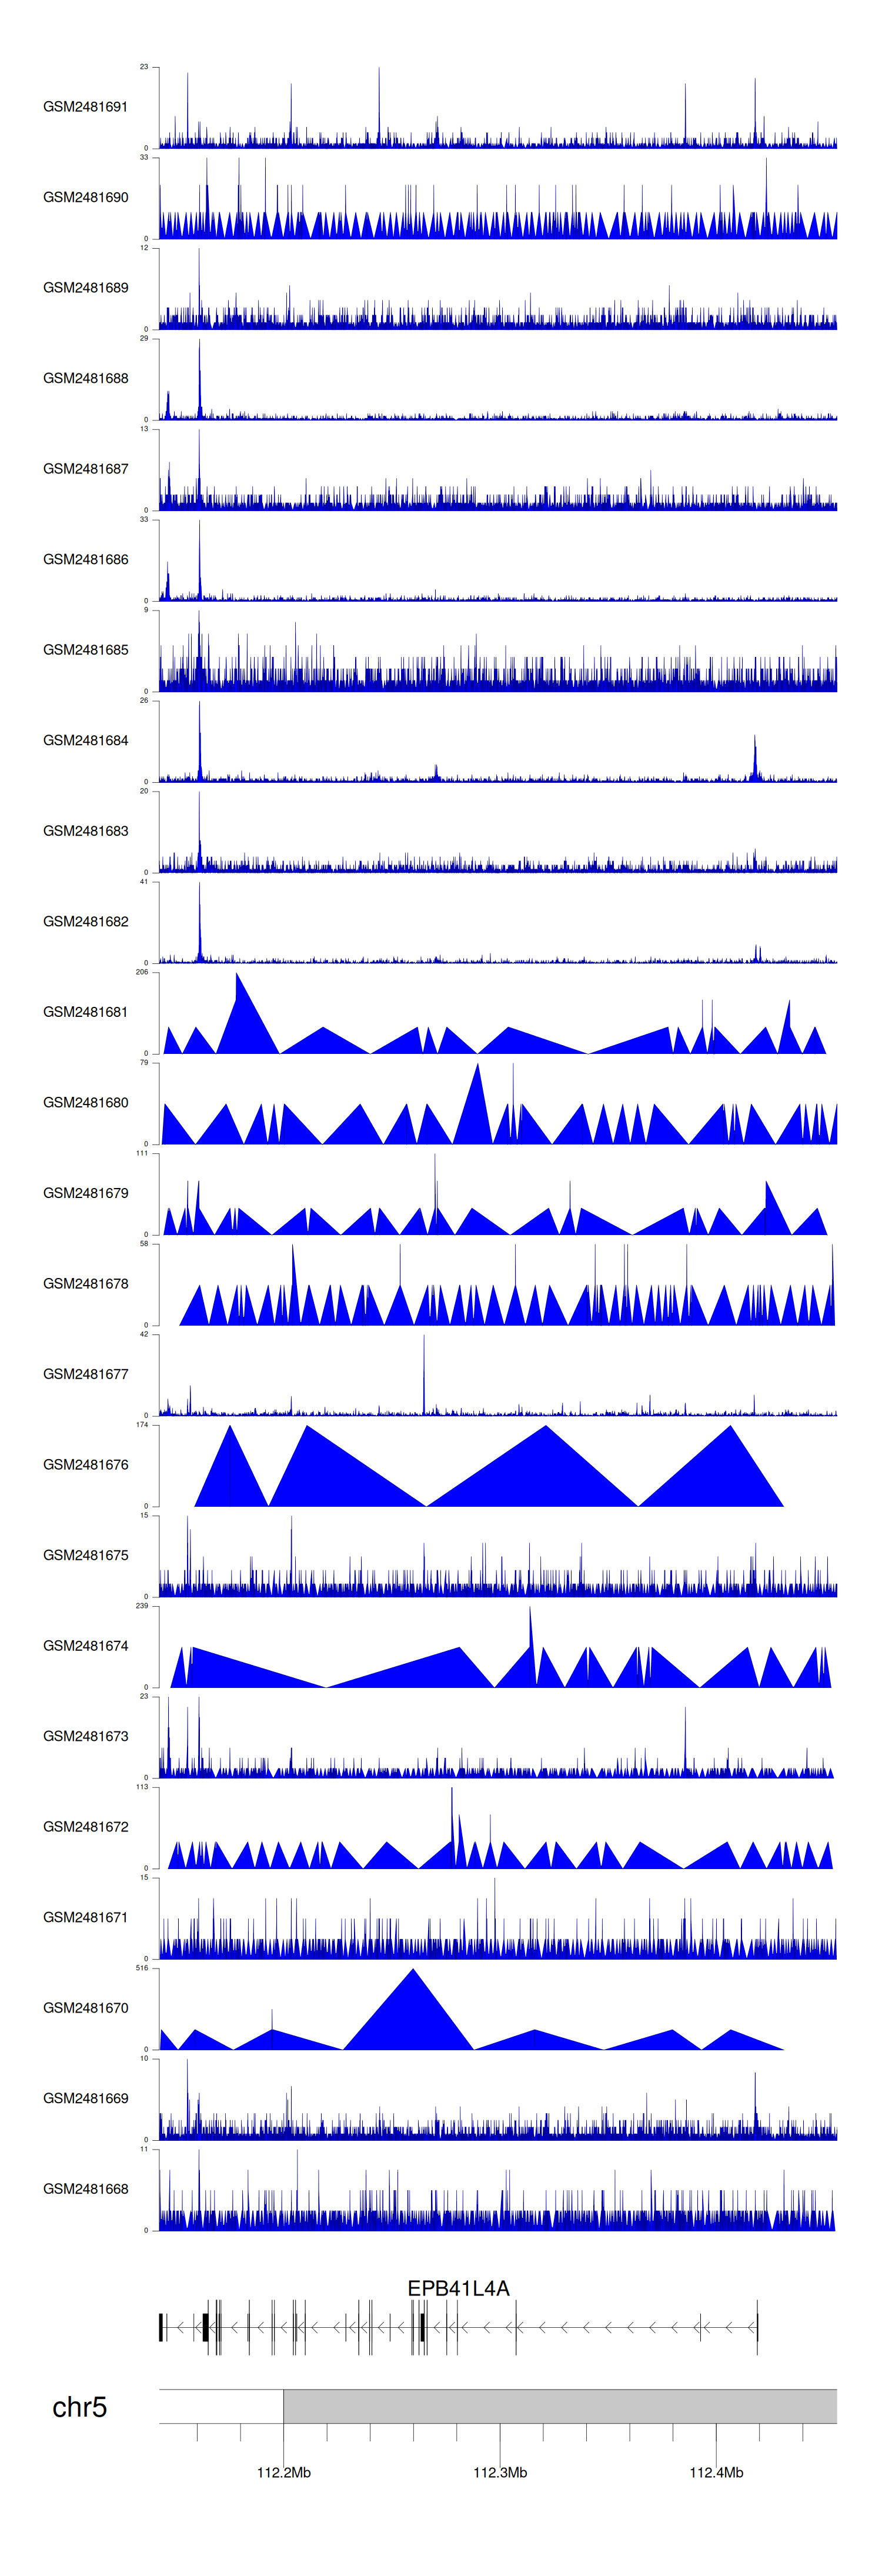
C
  GSE94732
Chip-seq 24 Illumina NextSeq 500 (Homo sapiens);illumina Genome Analyzer IIx (Homo sapiens)
GSE52244 Expression array 15 [HuEx-1_0-st] Affymetrix Human Exon 1.0 ST Array [probe set (exon) version]
GSE19080 Expression array 38 Homo sapiens 3K Immunoarray2 HTLV-1 JH
GSE10789 Expression array 6 NCI/ATC Hs-OperonV3
GSE224047 RNA-seq 10 Illumina NextSeq 500 (Homo sapiens)
GSE168557 Expression array 6 Agilent-039494 SurePrint G3 Human GE v2 8x60K Microarray 039381 (Feature Number version)
GSE136189 Methylation profiling (Array) 40 Illumina HumanMethylation450 BeadChip (HumanMethylation450_15017482);Illumina Infinium HumanMethylation850 BeadChip


When the gene can detect a peak in the dataset, a peak plot will be displayed.


> Dataset: GSE94732 - EPB41L4A peak across samples

Peak Plot