Gene Information
|
Gene Name
|
EPHB1 |
|
Gene ID
|
2047
|
|
Gene Full Name
|
EPH receptor B1 |
|
Gene Alias
|
ELK|EPHT2|Hek6|NET |
|
Transcripts
|
ENSG00000154928
|
|
Virus
|
HTLV1 |
|
Gene Type
|
protein-coding |
|
HPA Location Info
|
Endoplasmic reticulum, Plasma membrane;Cytosol; 
|
|
Membrane Info
|
Enzymes, Predicted intracellular proteins, Predicted membrane proteins |
|
Uniport_ID
|
P54762
|
|
HGNC ID
|
HGNC:3392
|
|
OMIM ID
|
600600 |
|
Summary
|
Ephrin receptors and their ligands, the ephrins, mediate numerous developmental processes, particularly in the nervous system. Based on their structures and sequence relationships, ephrins are divided into the ephrin-A (EFNA) class, which are anchored to the membrane by a glycosylphosphatidylinositol linkage, and the ephrin-B (EFNB) class, which are transmembrane proteins. The Eph family of receptors are divided into 2 groups based on the similarity of their extracellular domain sequences and their affinities for binding ephrin-A and ephrin-B ligands. Ephrin receptors make up the largest subgroup of the receptor tyrosine kinase (RTK) family. The protein encoded by this gene is a receptor for ephrin-B family members. [provided by RefSeq, Jul 2008] |
Target gene [EPHB1] related to VISs 
Integration Table: if previous studies reported that target gene was altered by virus integration events, the overlap between VISs in this literature and Cistrome factors was listed in this section
| DVID |
Chromosome |
HM |
TFBS |
CA |
Sum of Overlapped Records |
Detail |
| 6010125 |
chr3 |
22 |
9 |
2 |
33 |
View |
| 6010935 |
chr3 |
28 |
0 |
0 |
28 |
View |
| 6011205 |
chr3 |
20 |
2 |
5 |
27 |
View |
| 6029282 |
chr3 |
1 |
0 |
0 |
1 |
View |
| 6029283 |
chr3 |
1 |
0 |
0 |
1 |
View |
| 6029284 |
chr3 |
1 |
0 |
0 |
1 |
View |
| 6029285 |
chr3 |
1 |
0 |
0 |
1 |
View |
| 6029286 |
chr3 |
1 |
0 |
0 |
1 |
View |
| 6029991 |
chr3 |
1 |
0 |
0 |
1 |
View |
| 6032456 |
chr3 |
0 |
0 |
0 |
0 |
View |
Target gene [EPHB1] related to Omics data
| Data ID |
Experiment type |
Sample number |
Platform |
|
GSE189602
|
Methylation profiling (Array) |
4 |
Infinium MethylationEPIC |
|
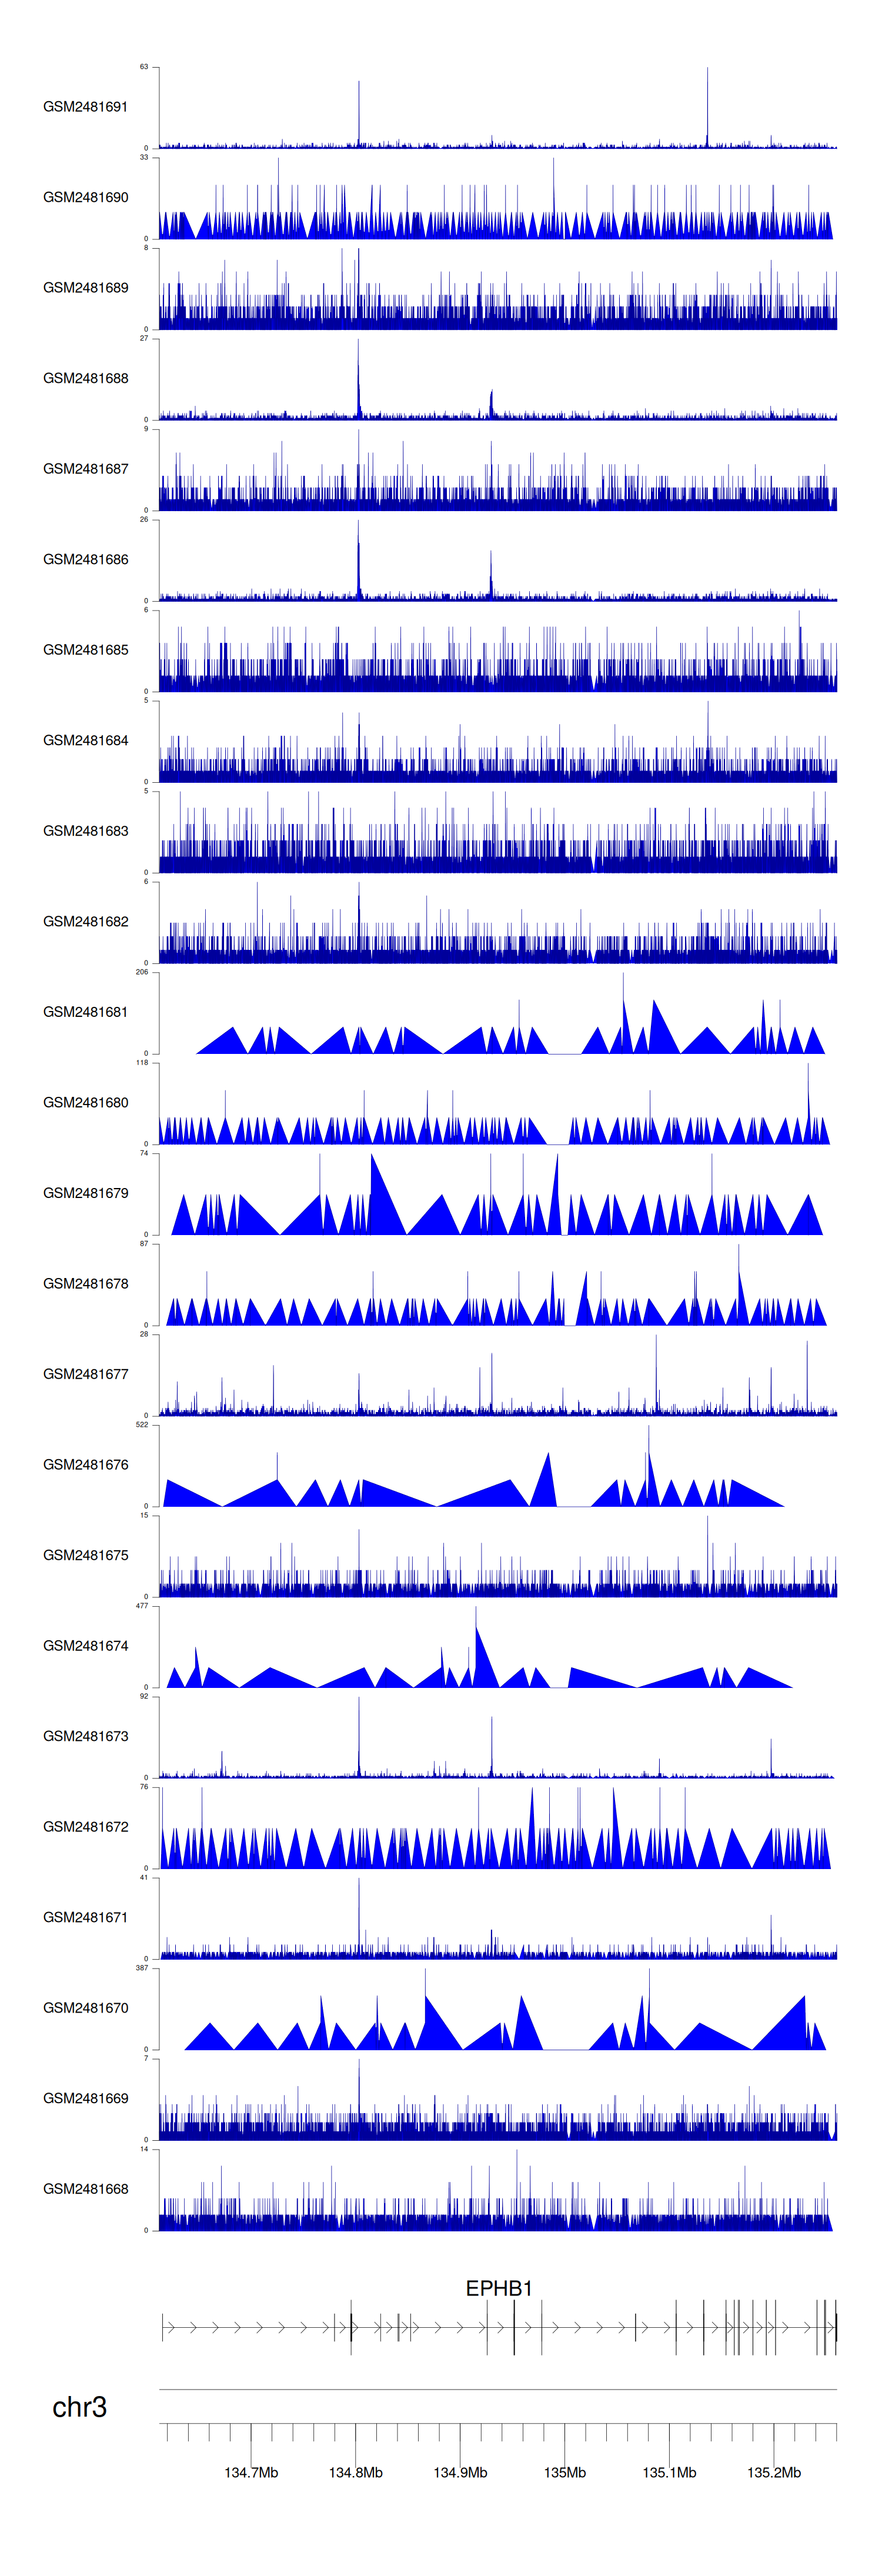
C GSE94732
|
Chip-seq |
24 |
Illumina NextSeq 500 (Homo sapiens);illumina Genome Analyzer IIx (Homo sapiens) |
|
GSE52244
|
Expression array |
15 |
[HuEx-1_0-st] Affymetrix Human Exon 1.0 ST Array [probe set (exon) version] |
|
GSE19080
|
Expression array |
38 |
Homo sapiens 3K Immunoarray2 HTLV-1 JH |
|
GSE224047
|
RNA-seq |
10 |
Illumina NextSeq 500 (Homo sapiens) |
|
GSE168557
|
Expression array |
6 |
Agilent-039494 SurePrint G3 Human GE v2 8x60K Microarray 039381 (Feature Number version) |
|
GSE136189
|
Methylation profiling (Array) |
40 |
Illumina HumanMethylation450 BeadChip (HumanMethylation450_15017482);Illumina Infinium HumanMethylation850 BeadChip |
When the gene can detect a peak in the dataset, a peak plot will be displayed.
> Dataset: GSE94732 - EPHB1 peak across samples
|
Peak Plot
|
|
|
