Gene Information
|
Gene Name
|
FBLN5 |
|
Gene ID
|
10516
|
|
Gene Full Name
|
fibulin 5 |
|
Gene Alias
|
ADCL2|ARCL1A|ARMD3|CMT1H|DANCE|EVEC|FIBL-5|HNARMD|UP50 |
|
Transcripts
|
ENSG00000140092
|
|
Virus
|
HBV |
|
Gene Type
|
protein-coding |
|
HPA Location Info
|
Plasma membrane;Secreted to extracellular matrix; 
|
|
Membrane Info
|
Disease related genes, Human disease related genes, Plasma proteins, Predicted intracellular proteins, Predicted secreted proteins |
|
Uniport_ID
|
Q9UBX5
|
|
HGNC ID
|
HGNC:3602
|
|
OMIM ID
|
604580 |
|
Summary
|
The protein encoded by this gene is a secreted, extracellular matrix protein containing an Arg-Gly-Asp (RGD) motif and calcium-binding EGF-like domains. It promotes adhesion of endothelial cells through interaction of integrins and the RGD motif. It is prominently expressed in developing arteries but less so in adult vessels. However, its expression is reinduced in balloon-injured vessels and atherosclerotic lesions, notably in intimal vascular smooth muscle cells and endothelial cells. Therefore, the protein encoded by this gene may play a role in vascular development and remodeling. Defects in this gene are a cause of autosomal dominant cutis laxa, autosomal recessive cutis laxa type I (CL type I), and age-related macular degeneration type 3 (ARMD3). [provided by RefSeq, Jul 2008] |
Target gene [FBLN5] related to VISs 
Integration Table: if previous studies reported that target gene was altered by virus integration events, the overlap between VISs in this literature and Cistrome factors was listed in this section
| DVID |
Chromosome |
HM |
TFBS |
CA |
Sum of Overlapped Records |
Detail |
| 1012388 |
chr14 |
4 |
3 |
0 |
7 |
View |
Target gene [FBLN5] related to Omics data
| Data ID |
Experiment type |
Sample number |
Platform |
|
GSE252863
|
scRNA-seq |
10 |
Illumina HiSeq 2500 (Homo sapiens) |
|
GSE236281
|
RNA-seq |
12 |
Illumina MiSeq (Homo sapiens) |
|
C GSE35465
|
Chip-seq;RNA-seq |
6 |
Illumina HiSeq 2000 (Homo sapiens) |
|
GSE199850
|
scRNA-seq |
1 |
HiSeq X Ten (Homo sapiens) |
|
C GSE68402
|
Chip-seq |
26 |
Illumina MiSeq (Homo sapiens);Illumina HiSeq 2500 (Homo sapiens) |
|
GSE247322
|
scRNA-seq |
27 |
Illumina NovaSeq 6000 (Homo sapiens) |
|
TCGA_LIHC_HBV
|
DNA methylation sequencing;RNA-seq |
97 |
TCGA |
|
C GSE270130
|
Chip-seq |
27 |
Illumina NovaSeq 6000 (Homo sapiens) |
|
GSE224901
|
RNA-seq |
21 |
Illumina NovaSeq 6000 (Homo sapiens) |
|
GSE100400
|
Chip-seq;RNA-seq;4C_cccDNA |
31 |
Illumina NextSeq 500 (Homo sapiens);Illumina NextSeq 500 (Mus musculus) |
|
GSE173897
|
RNA-seq |
95 |
Illumina HiSeq 4000 (Homo sapiens) |
|
GSE262515
|
RNA-seq |
21 |
Illumina HiSeq 2500 (Homo sapiens);Illumina HiSeq 2500 (Mus musculus) |
|
GSE110345
|
RNA-seq |
4 |
Illumina HiSeq 2500 (Homo sapiens) |
|
C GSE131257
|
ATAC-seq;RNA-seq |
19 |
Illumina HiSeq 2500 (Homo sapiens) |
|
GSE94660
|
RNA-seq |
42 |
Illumina HiSeq 2500 (Homo sapiens) |
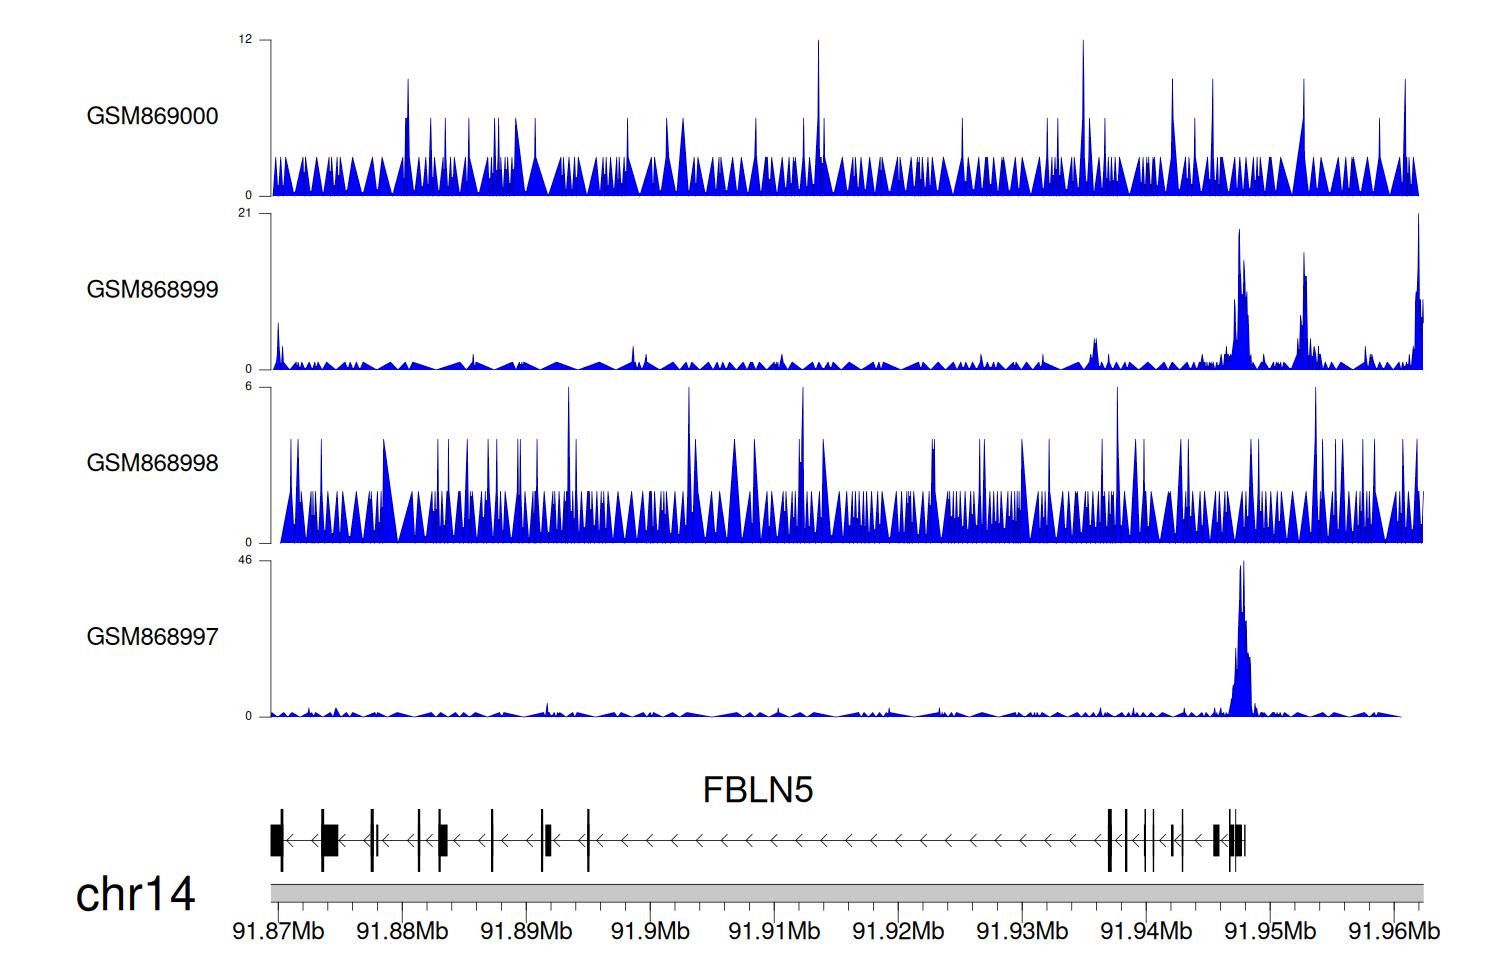
When the gene can detect a peak in the dataset, a peak plot will be displayed.
> Dataset: GSE35465 - FBLN5 peak across samples
|
Peak Plot
|
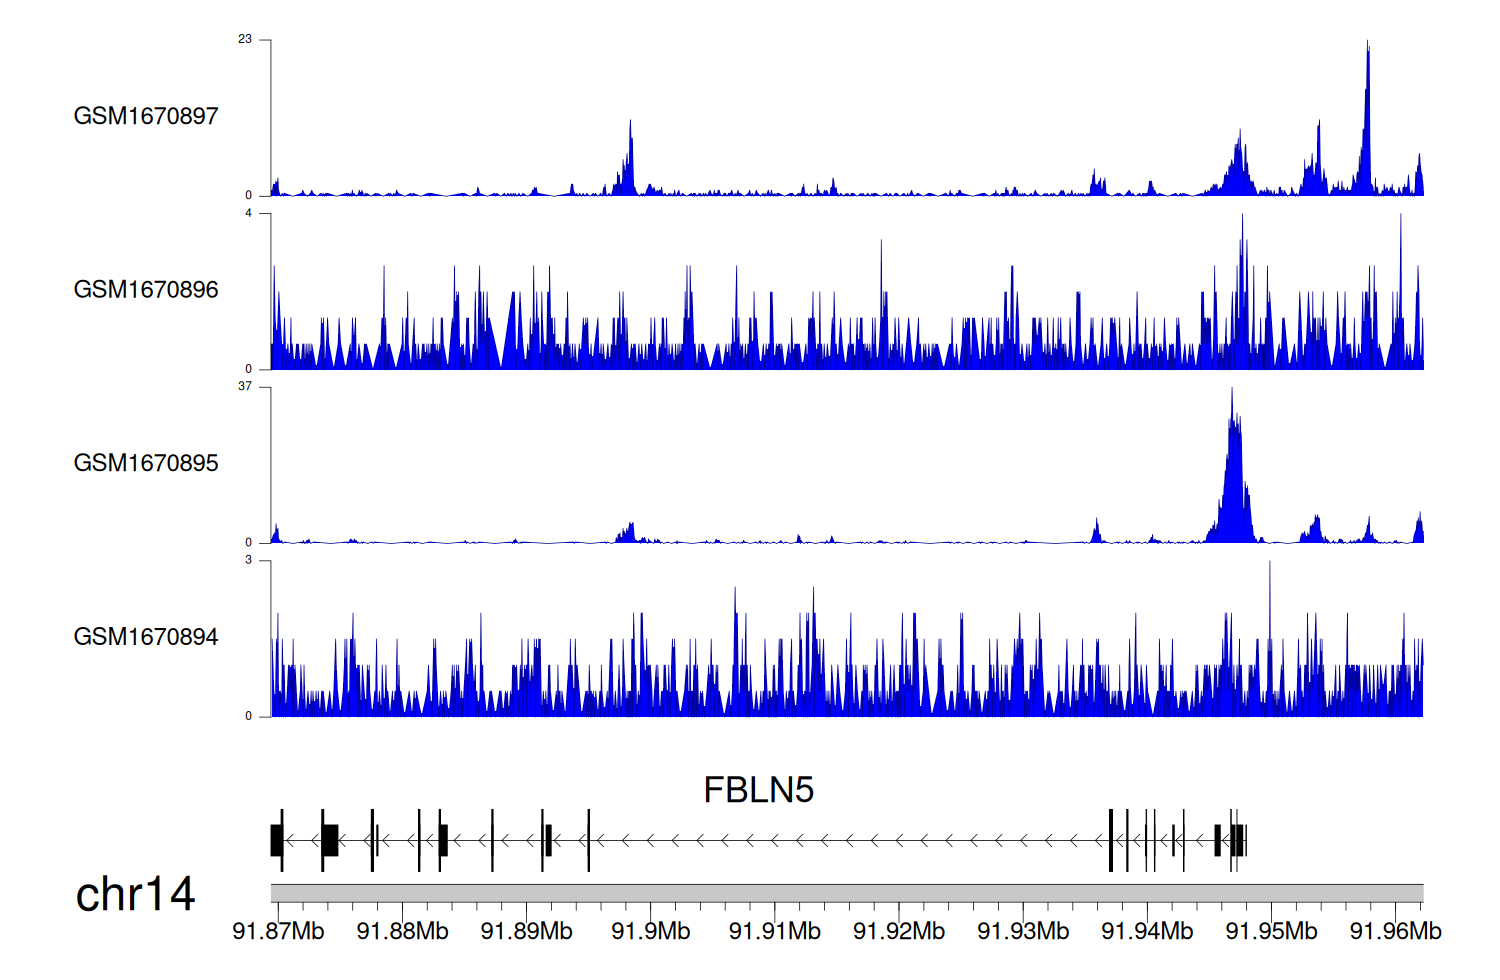
> Dataset: GSE68402 - FBLN5 peak across samples
|
Peak Plot
|
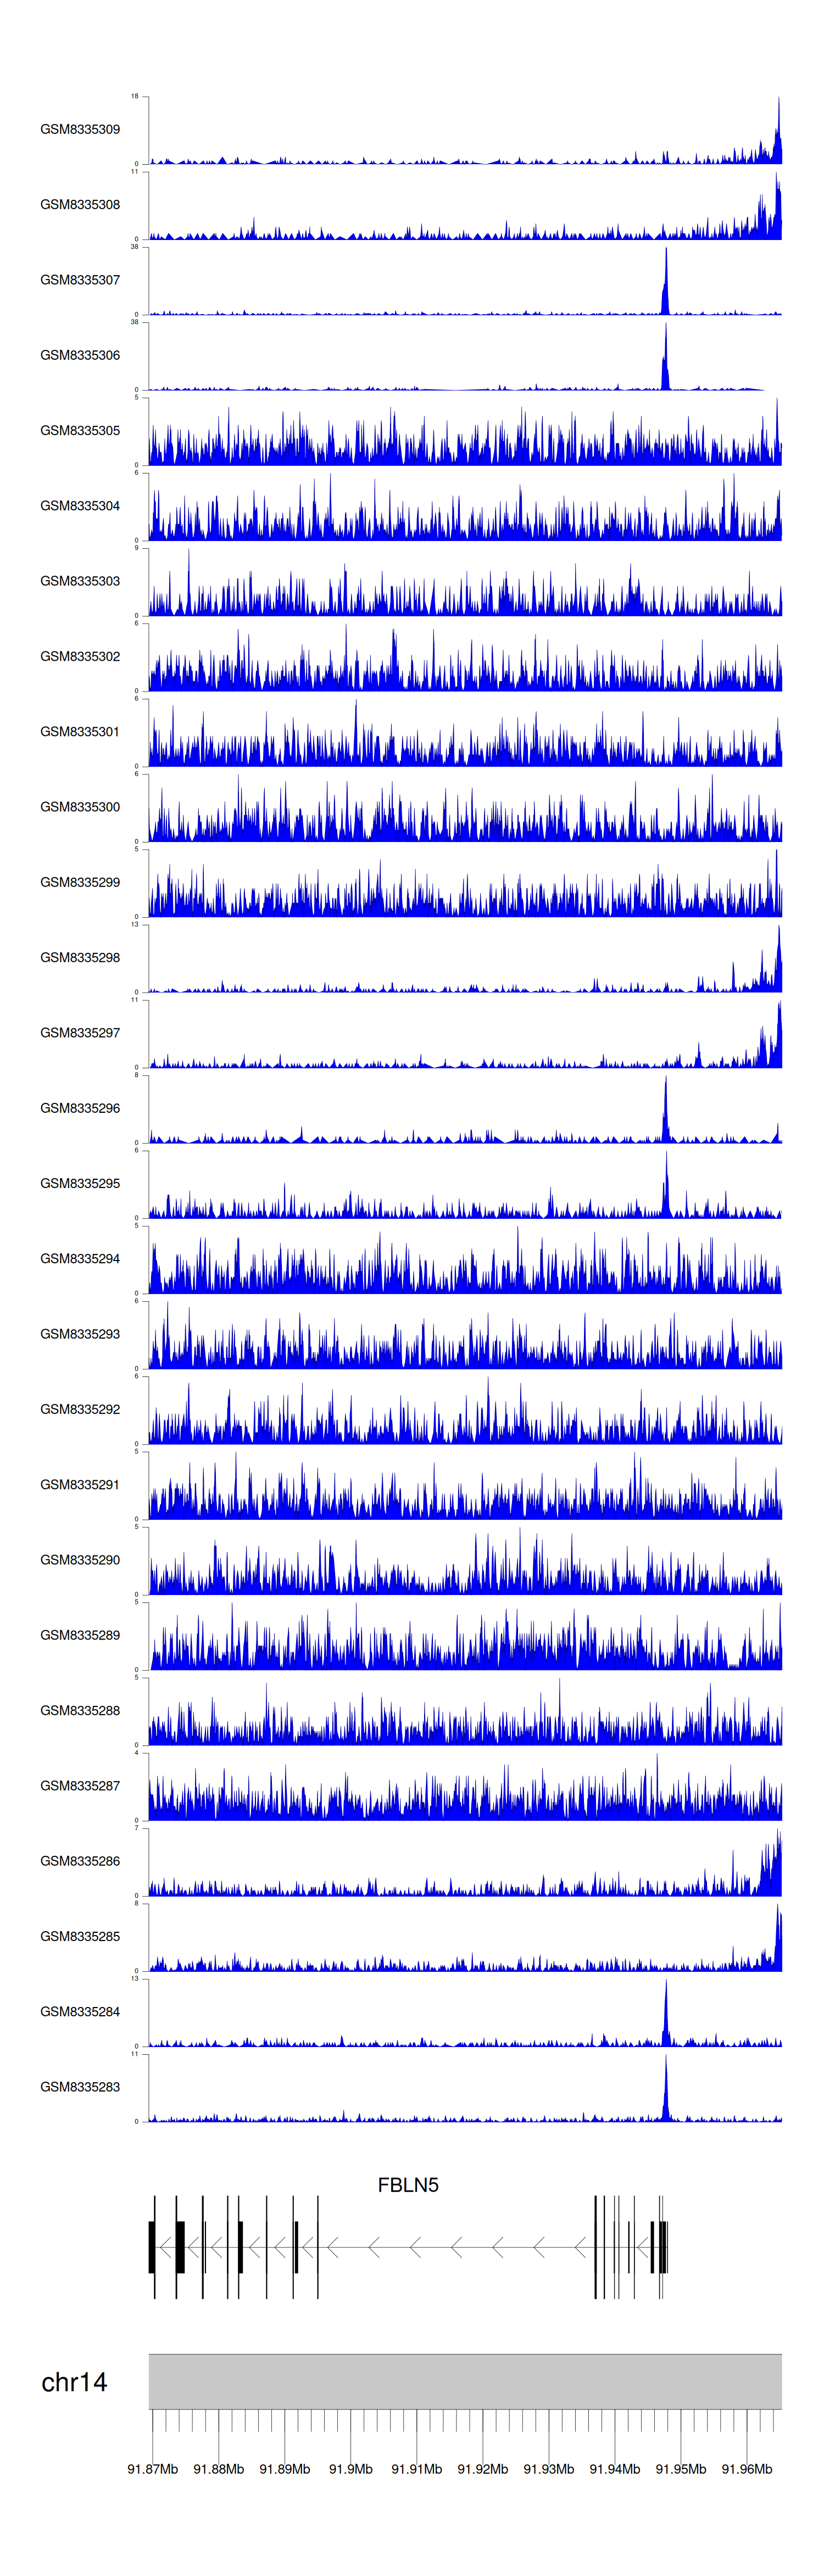
> Dataset: GSE270130 - FBLN5 peak across samples
|
Peak Plot
|
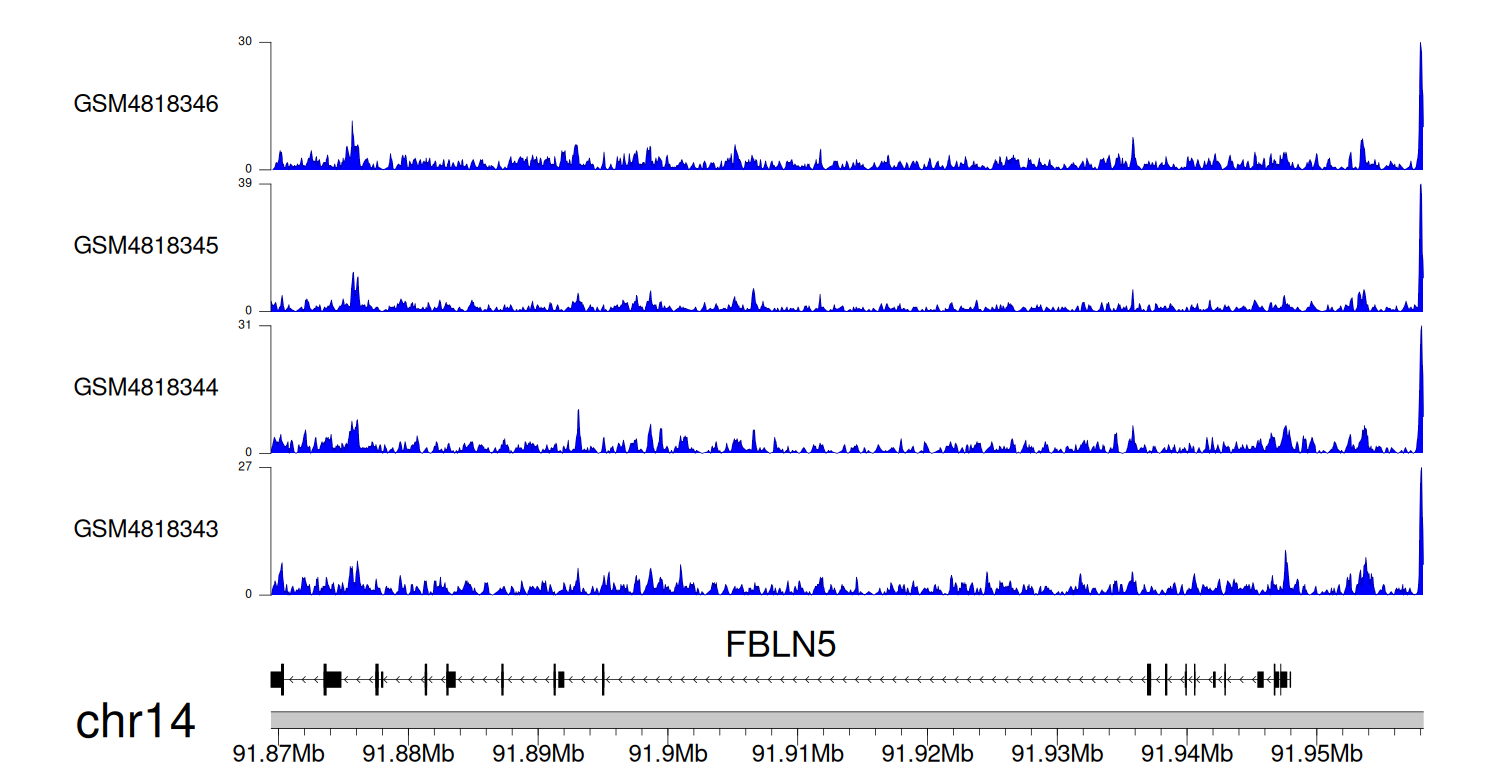
> Dataset: GSE131257 - FBLN5 peak across samples
|
Peak Plot
|
|
|
