Gene Information
|
Gene Name
|
FBXW5 |
|
Gene ID
|
54461
|
|
Gene Full Name
|
F-box and WD repeat domain containing 5 |
|
Gene Alias
|
Fbw5 |
|
Transcripts
|
ENSG00000159069
|
|
Virus
|
HBV |
|
Gene Type
|
protein-coding |
|
HPA Location Info
|
Mitochondria; 
|
|
Membrane Info
|
Predicted intracellular proteins |
|
Uniport_ID
|
Q969U6
|
|
HGNC ID
|
HGNC:13613
|
|
OMIM ID
|
609072 |
|
Summary
|
This gene encodes a member of the F-box protein family, members of which are characterized by an approximately 40 amino acid motif, the F-box. The F-box proteins constitute one of the four subunits of ubiquitin protein ligase complex called SCFs (SKP1-cullin-F-box), which function in phosphorylation-dependent ubiquitination. The F-box proteins are divided into three classes: Fbws containing WD-40 domains, Fbls containing leucine-rich repeats, and Fbxs containing either different protein-protein interaction modules or no recognizable motifs. The protein encoded by this gene contains WD-40 domains, in addition to an F-box motif, so it belongs to the Fbw class. Alternatively spliced transcript variants encoding distinct isoforms have been identified for this gene, however, they were found to be nonsense-mediated mRNA decay (NMD) candidates, hence not represented. [provided by RefSeq, Jul 2008] |
Target gene [FBXW5] related to VISs 
Integration Table: if previous studies reported that target gene was altered by virus integration events, the overlap between VISs in this literature and Cistrome factors was listed in this section
| DVID |
Chromosome |
HM |
TFBS |
CA |
Sum of Overlapped Records |
Detail |
| 1040818 |
chr9 |
245 |
27 |
1 |
273 |
View |
| 1040819 |
chr9 |
241 |
25 |
1 |
267 |
View |
Target gene [FBXW5] related to Omics data
| Data ID |
Experiment type |
Sample number |
Platform |
|
GSE252863
|
scRNA-seq |
10 |
Illumina HiSeq 2500 (Homo sapiens) |
|
GSE236281
|
RNA-seq |
12 |
Illumina MiSeq (Homo sapiens) |
|
C GSE35465
|
Chip-seq;RNA-seq |
6 |
Illumina HiSeq 2000 (Homo sapiens) |
|
GSE199850
|
scRNA-seq |
1 |
HiSeq X Ten (Homo sapiens) |
|
C GSE68402
|
Chip-seq |
26 |
Illumina MiSeq (Homo sapiens);Illumina HiSeq 2500 (Homo sapiens) |
|
GSE247322
|
scRNA-seq |
27 |
Illumina NovaSeq 6000 (Homo sapiens) |
|
TCGA_LIHC_HBV
|
DNA methylation sequencing;RNA-seq |
97 |
TCGA |
|
C GSE270130
|
Chip-seq |
27 |
Illumina NovaSeq 6000 (Homo sapiens) |
|
GSE224901
|
RNA-seq |
21 |
Illumina NovaSeq 6000 (Homo sapiens) |
|
C GSE100400
|
Chip-seq;RNA-seq;4C_cccDNA |
31 |
Illumina NextSeq 500 (Homo sapiens);Illumina NextSeq 500 (Mus musculus) |
|
GSE173897
|
RNA-seq |
95 |
Illumina HiSeq 4000 (Homo sapiens) |
|
GSE262515
|
RNA-seq |
21 |
Illumina HiSeq 2500 (Homo sapiens);Illumina HiSeq 2500 (Mus musculus) |
|
GSE110345
|
RNA-seq |
4 |
Illumina HiSeq 2500 (Homo sapiens) |
|
C GSE131257
|
ATAC-seq;RNA-seq |
19 |
Illumina HiSeq 2500 (Homo sapiens) |
|
GSE94660
|
RNA-seq |
42 |
Illumina HiSeq 2500 (Homo sapiens) |
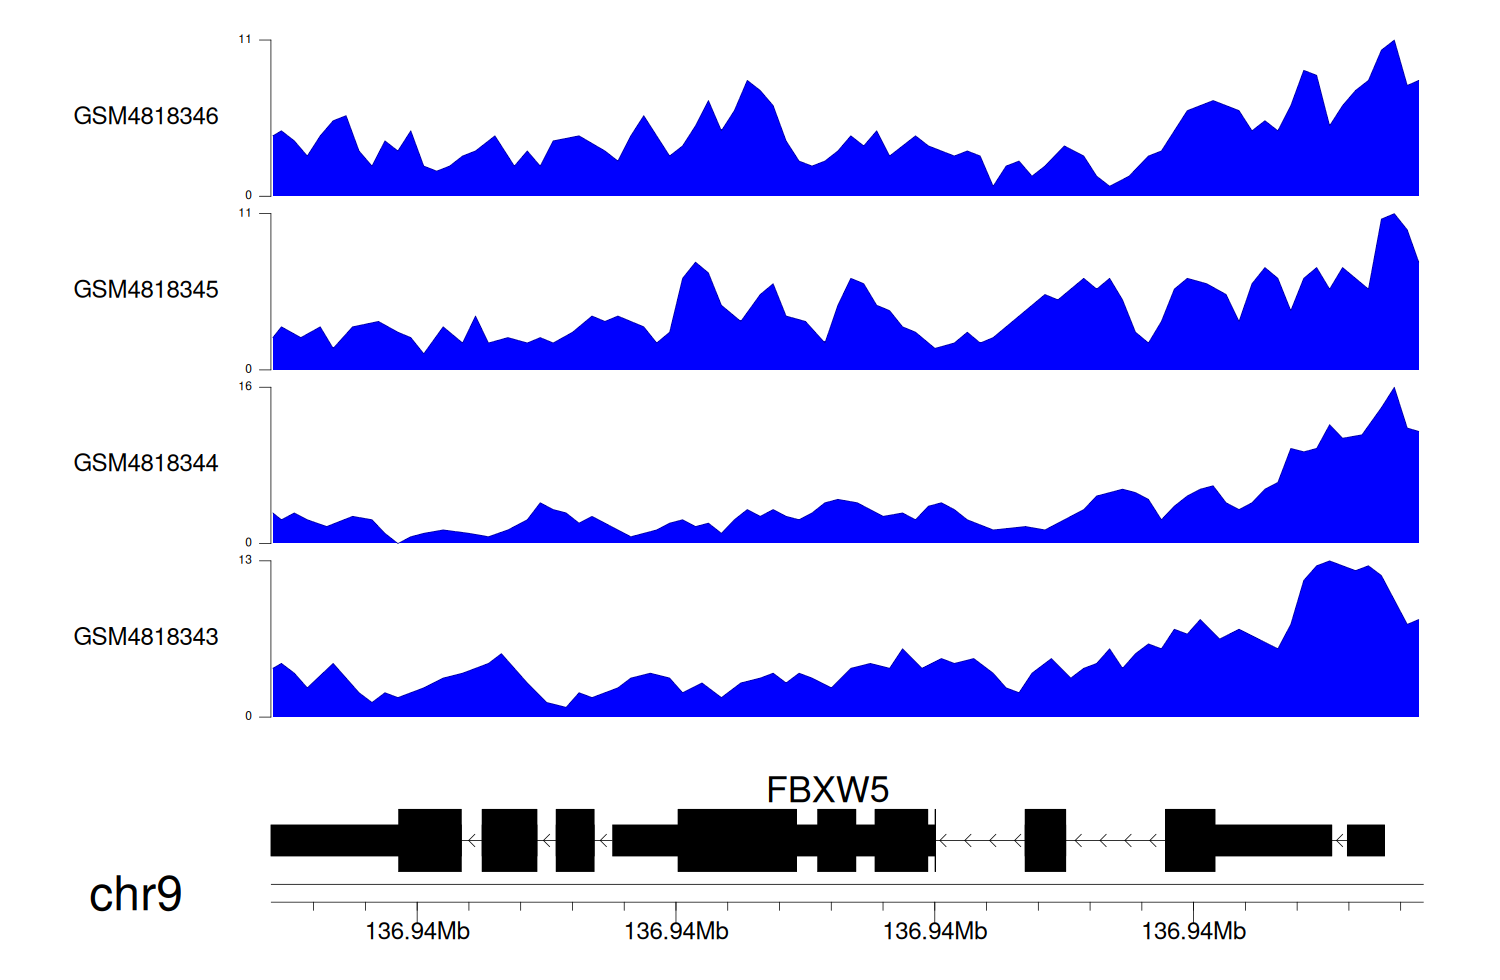
When the gene can detect a peak in the dataset, a peak plot will be displayed.
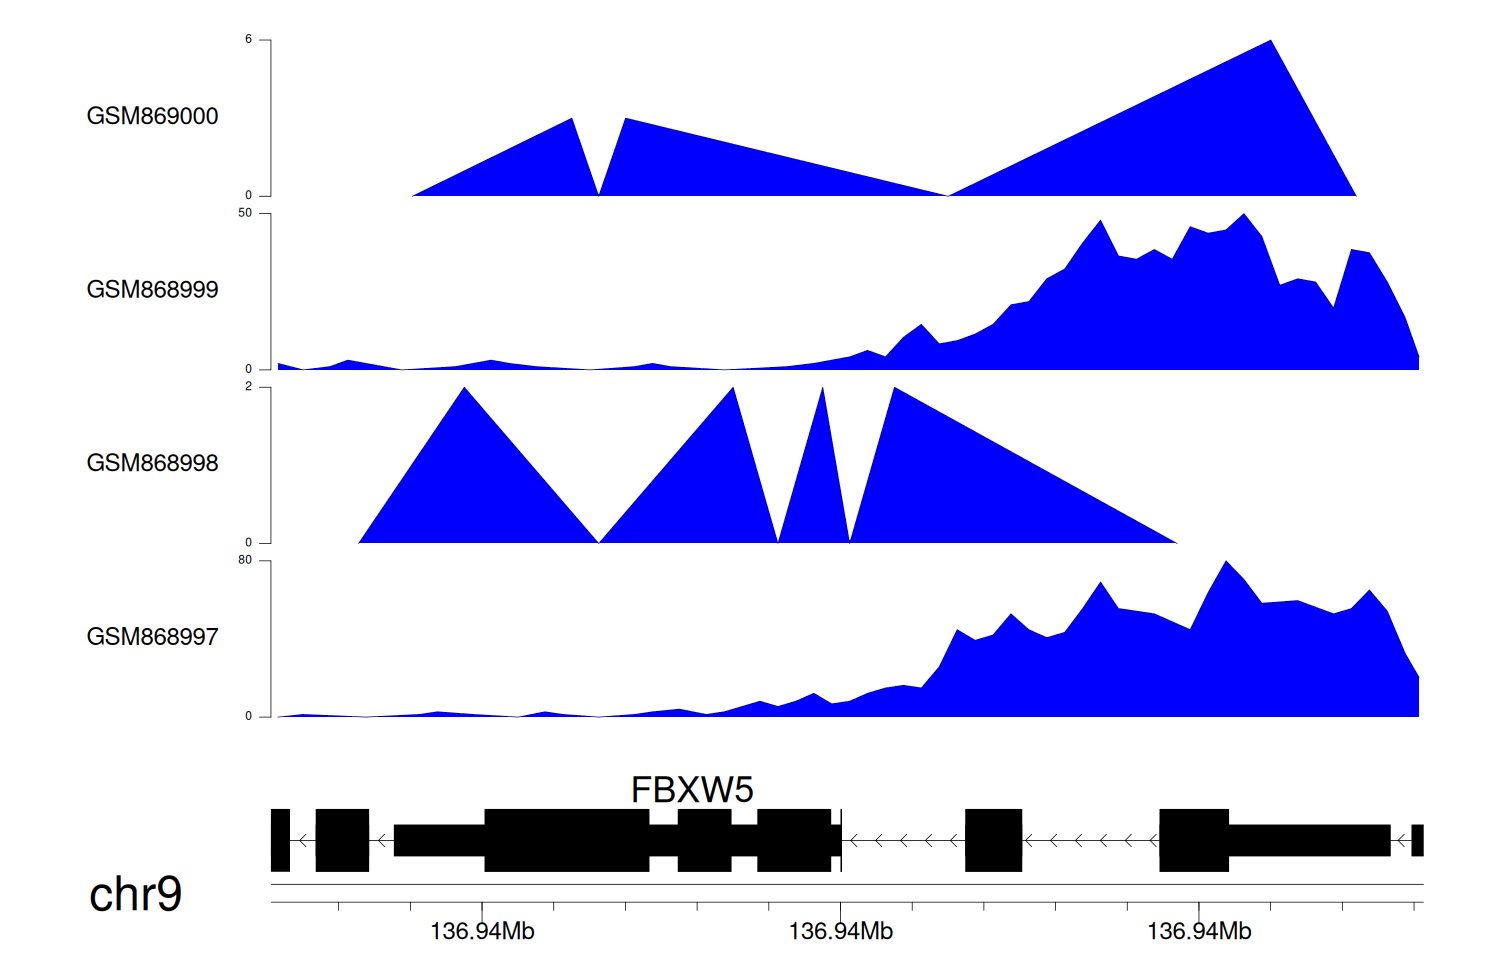
> Dataset: GSE35465 - FBXW5 peak across samples
|
Peak Plot
|
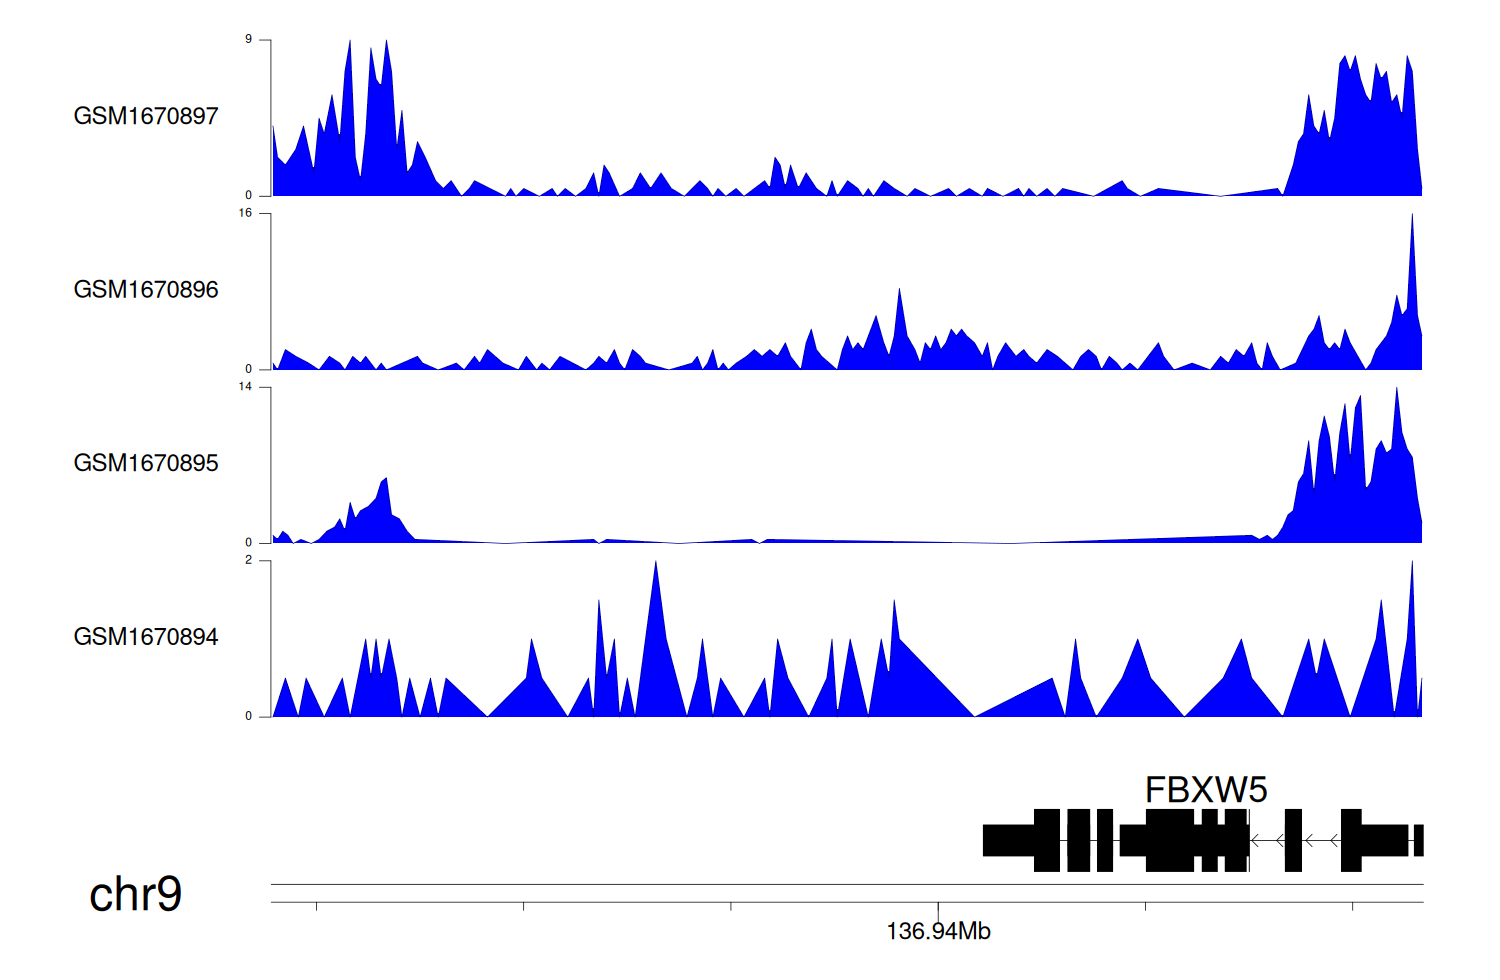
> Dataset: GSE68402 - FBXW5 peak across samples
|
Peak Plot
|
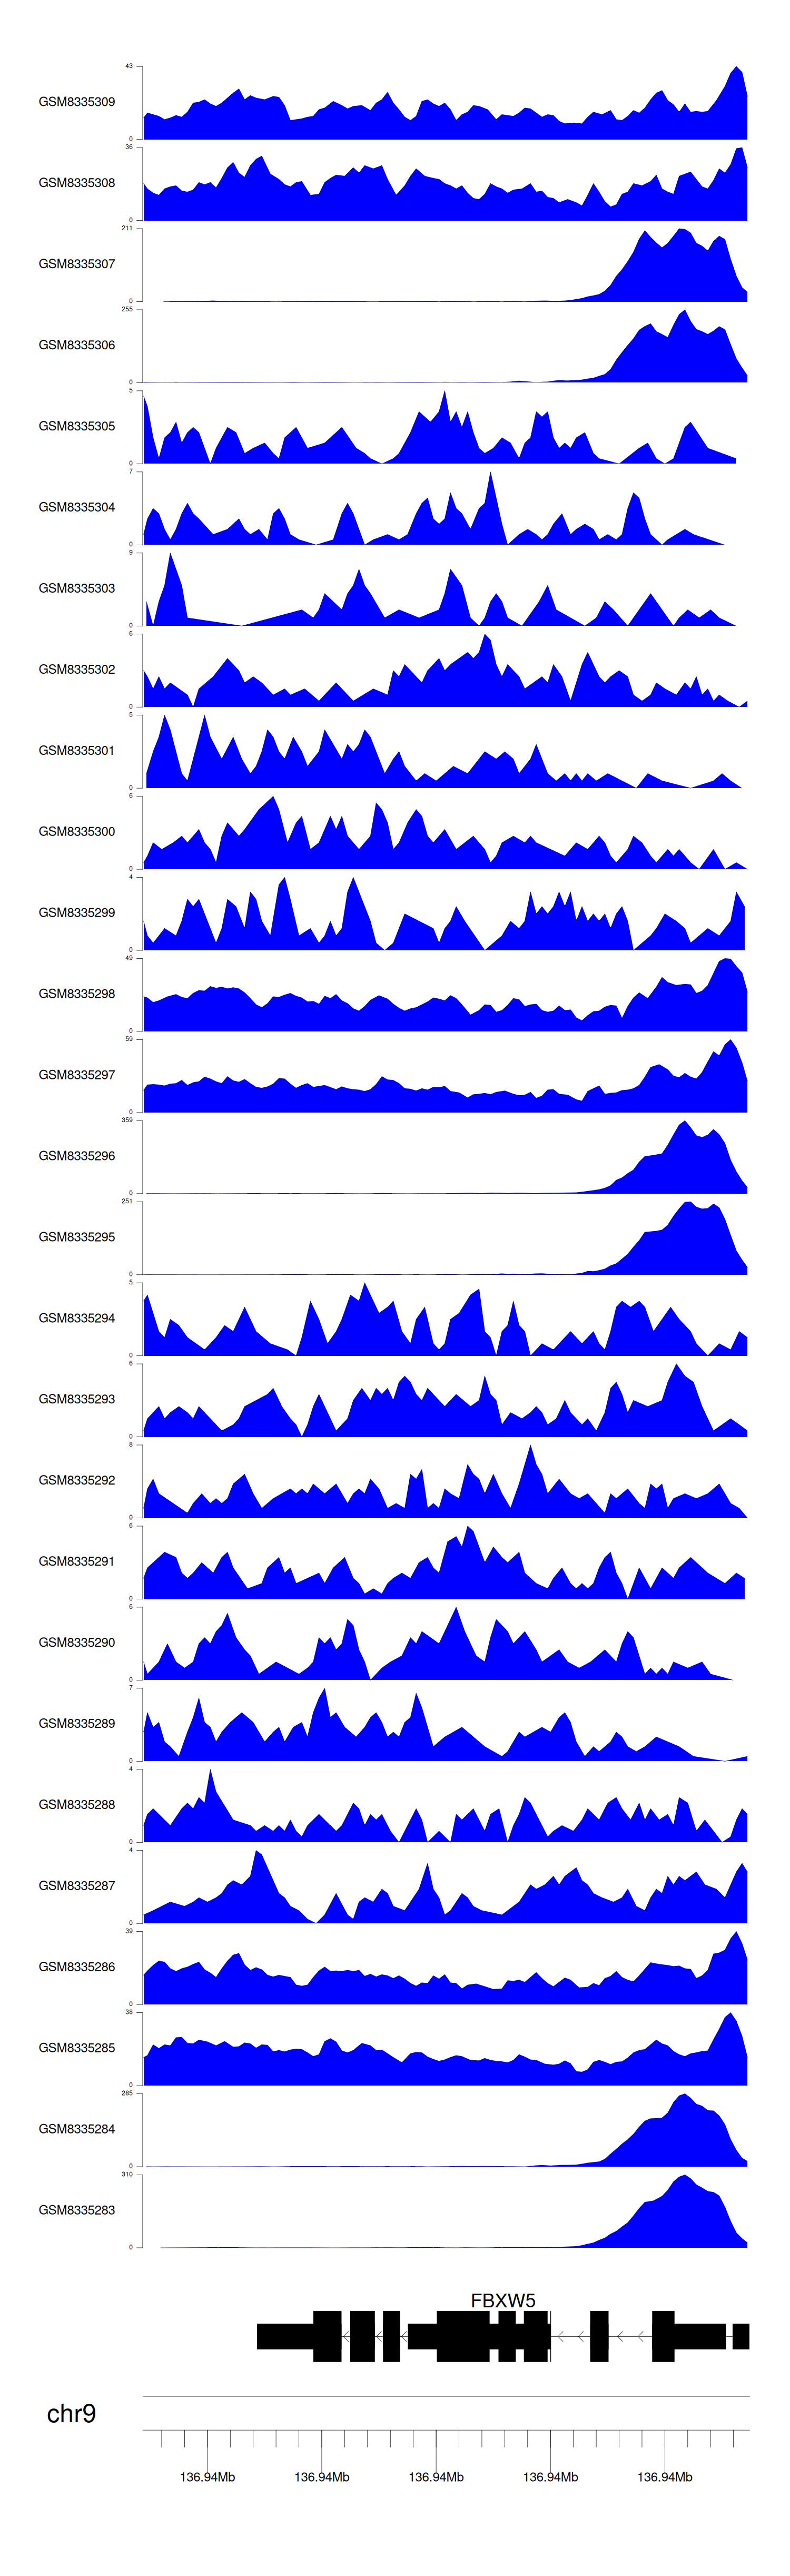
> Dataset: GSE270130 - FBXW5 peak across samples
|
Peak Plot
|
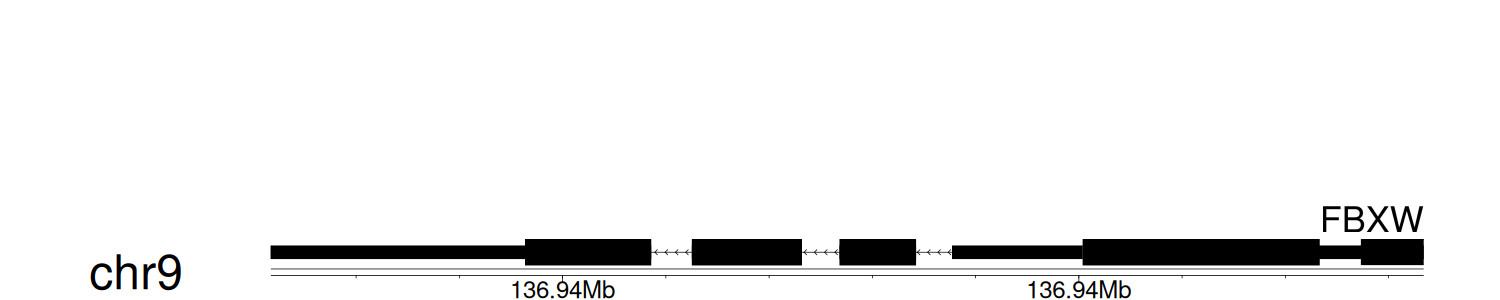
> Dataset: GSE100400 - FBXW5 peak across samples
|
Peak Plot
|
> Dataset: GSE131257 - FBXW5 peak across samples
|
Peak Plot
|
|
|
