Gene Information
|
Gene Name
|
GSTA2 |
|
Gene ID
|
2939
|
|
Gene Full Name
|
glutathione S-transferase alpha 2 |
|
Gene Alias
|
GST2|GSTA2-2|GTA2|GTH2 |
|
Transcripts
|
ENSG00000244067
|
|
Virus
|
HBV |
|
Gene Type
|
protein-coding |
|
HPA Location Info
|
Cytosol; 
|
|
Membrane Info
|
Enzymes, Metabolic proteins, Predicted intracellular proteins |
|
Uniport_ID
|
P09210
|
|
HGNC ID
|
HGNC:4627
|
|
OMIM ID
|
138360 |
|
Summary
|
Cytosolic and membrane-bound forms of glutathione S-transferase are encoded by two distinct supergene families. These enzymes function in the detoxification of electrophilic compounds, including carcinogens, therapeutic drugs, environmental toxins and products of oxidative stress, by conjugation with glutathione. The genes encoding these enzymes are known to be highly polymorphic. These genetic variations can change an individual's susceptibility to carcinogens and toxins as well as affect the toxicity and efficacy of some drugs. At present, eight distinct classes of the soluble cytoplasmic mammalian glutathione S-transferases have been identified: alpha, kappa, mu, omega, pi, sigma, theta and zeta. This gene encodes a glutathione S-tranferase belonging to the alpha class. The alpha class genes, located in a cluster mapped to chromosome 6, are the most abundantly expressed glutathione S-transferases in liver. In addition to metabolizing bilirubin and certain anti-cancer drugs in the liver, the alpha class of these enzymes exhibit glutathione peroxidase activity thereby protecting the cells from reactive oxygen species and the products of peroxidation. [provided by RefSeq, Jul 2008] |
Target gene [GSTA2] related to VISs 
Integration Table: if previous studies reported that target gene was altered by virus integration events, the overlap between VISs in this literature and Cistrome factors was listed in this section
| DVID |
Chromosome |
HM |
TFBS |
CA |
Sum of Overlapped Records |
Detail |
| 1024518 |
chr6 |
24 |
2 |
0 |
26 |
View |
| 1040492 |
chr6 |
3 |
4 |
0 |
7 |
View |
| 1040493 |
chr6 |
2 |
4 |
0 |
6 |
View |
| 1040494 |
chr6 |
2 |
4 |
0 |
6 |
View |
| 1040495 |
chr6 |
2 |
4 |
0 |
6 |
View |
| 1040496 |
chr6 |
2 |
4 |
0 |
6 |
View |
| 1040497 |
chr6 |
2 |
4 |
0 |
6 |
View |
Target gene [GSTA2] related to Omics data
| Data ID |
Experiment type |
Sample number |
Platform |
|
S GSE252863
|
scRNA-seq |
10 |
Illumina HiSeq 2500 (Homo sapiens) |
|
GSE236281
|
RNA-seq |
12 |
Illumina MiSeq (Homo sapiens) |
|
C GSE35465
|
Chip-seq;RNA-seq |
6 |
Illumina HiSeq 2000 (Homo sapiens) |
|
S GSE199850
|
scRNA-seq |
1 |
HiSeq X Ten (Homo sapiens) |
|
C GSE68402
|
Chip-seq |
26 |
Illumina MiSeq (Homo sapiens);Illumina HiSeq 2500 (Homo sapiens) |
|
S GSE247322
|
scRNA-seq |
27 |
Illumina NovaSeq 6000 (Homo sapiens) |
|
TCGA_LIHC_HBV
|
DNA methylation sequencing;RNA-seq |
97 |
TCGA |
|
C GSE270130
|
Chip-seq |
27 |
Illumina NovaSeq 6000 (Homo sapiens) |
|
GSE224901
|
RNA-seq |
21 |
Illumina NovaSeq 6000 (Homo sapiens) |
|
E GSE100400
|
Chip-seq;RNA-seq;4C_cccDNA |
31 |
Illumina NextSeq 500 (Homo sapiens);Illumina NextSeq 500 (Mus musculus) |
|
GSE173897
|
RNA-seq |
95 |
Illumina HiSeq 4000 (Homo sapiens) |
|
GSE262515
|
RNA-seq |
21 |
Illumina HiSeq 2500 (Homo sapiens);Illumina HiSeq 2500 (Mus musculus) |
|
GSE110345
|
RNA-seq |
4 |
Illumina HiSeq 2500 (Homo sapiens) |
|
C GSE131257
|
ATAC-seq;RNA-seq |
19 |
Illumina HiSeq 2500 (Homo sapiens) |
|
E GSE94660
|
RNA-seq |
42 |
Illumina HiSeq 2500 (Homo sapiens) |
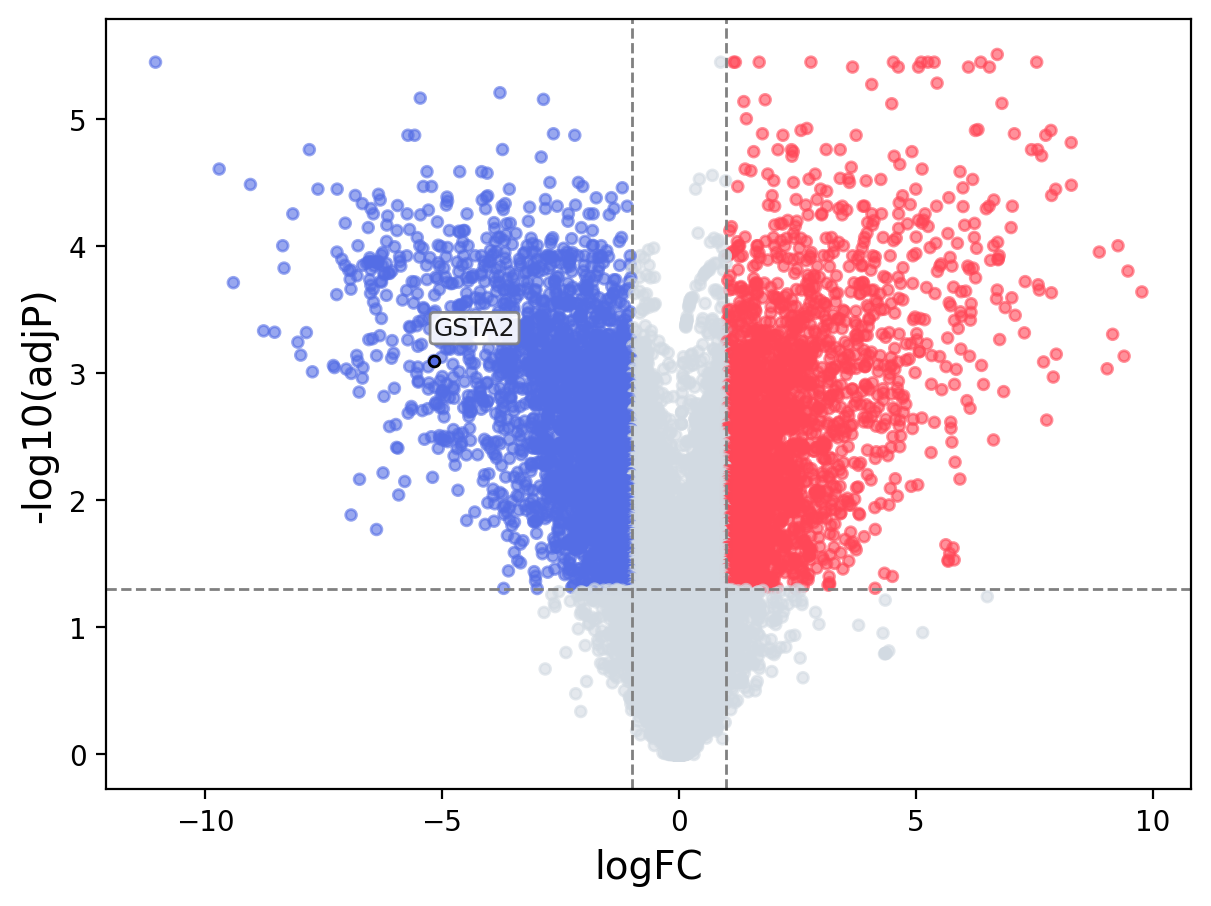
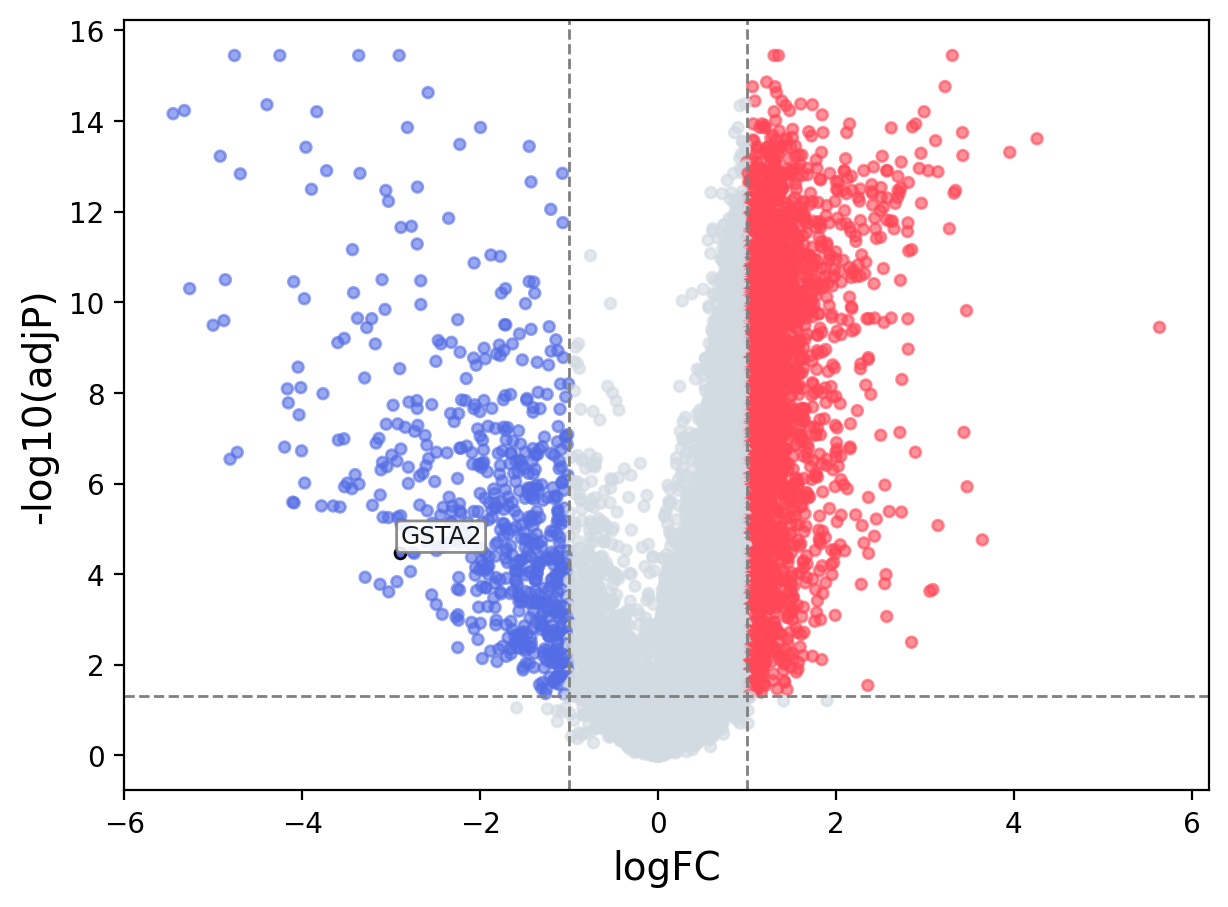
When the query gene is differentially changed in the dataset, a volcano/bar plot will be displayed.
> Dataset: GSE100400 - GSTA2 expression across samples
|
Volcano Plot
|
Bar Plot
|
> Dataset: GSE94660 - GSTA2 expression across samples
|
Volcano Plot
|
Bar Plot
|
|
|
