Gene Information
|
Gene Name
|
IDH3A |
|
Gene ID
|
3419
|
|
Gene Full Name
|
isocitrate dehydrogenase (NAD(+)) 3 catalytic subunit alpha |
|
Gene Alias
|
RP90 |
|
Transcripts
|
ENSG00000166411
|
|
Virus
|
HBV |
|
Gene Type
|
protein-coding |
|
HPA Location Info
|
Mitochondria; 
|
|
Membrane Info
|
Citric acid cycle related proteins, Disease related genes, Enzymes, FDA approved drug targets, Human disease related genes, Metabolic proteins, Plasma proteins, Predicted intracellular proteins |
|
Uniport_ID
|
P50213
|
|
HGNC ID
|
HGNC:5384
|
|
OMIM ID
|
601149 |
|
Summary
|
Isocitrate dehydrogenases catalyze the oxidative decarboxylation of isocitrate to 2-oxoglutarate. These enzymes belong to two distinct subclasses, one of which utilizes NAD(+) as the electron acceptor and the other NADP(+). Five isocitrate dehydrogenases have been reported: three NAD(+)-dependent isocitrate dehydrogenases, which localize to the mitochondrial matrix, and two NADP(+)-dependent isocitrate dehydrogenases, one of which is mitochondrial and the other predominantly cytosolic. NAD(+)-dependent isocitrate dehydrogenases catalyze the allosterically regulated rate-limiting step of the tricarboxylic acid cycle. Each isozyme is a heterotetramer that is composed of two alpha subunits, one beta subunit, and one gamma subunit. The protein encoded by this gene is the alpha subunit of one isozyme of NAD(+)-dependent isocitrate dehydrogenase. [provided by RefSeq, Jul 2008] |
Target gene [IDH3A] related to VISs 
Integration Table: if previous studies reported that target gene was altered by virus integration events, the overlap between VISs in this literature and Cistrome factors was listed in this section
| DVID |
Chromosome |
HM |
TFBS |
CA |
Sum of Overlapped Records |
Detail |
| 1012532 |
chr15 |
4 |
2 |
0 |
6 |
View |
| 1022537 |
chr15 |
4 |
2 |
0 |
6 |
View |
Target gene [IDH3A] related to Omics data
| Data ID |
Experiment type |
Sample number |
Platform |
|
S GSE252863
|
scRNA-seq |
10 |
Illumina HiSeq 2500 (Homo sapiens) |
|
GSE236281
|
RNA-seq |
12 |
Illumina MiSeq (Homo sapiens) |
|
C GSE35465
|
Chip-seq;RNA-seq |
6 |
Illumina HiSeq 2000 (Homo sapiens) |
|
GSE199850
|
scRNA-seq |
1 |
HiSeq X Ten (Homo sapiens) |
|
C GSE68402
|
Chip-seq |
26 |
Illumina MiSeq (Homo sapiens);Illumina HiSeq 2500 (Homo sapiens) |
|
S GSE247322
|
scRNA-seq |
27 |
Illumina NovaSeq 6000 (Homo sapiens) |
|
TCGA_LIHC_HBV
|
DNA methylation sequencing;RNA-seq |
97 |
TCGA |
|
C GSE270130
|
Chip-seq |
27 |
Illumina NovaSeq 6000 (Homo sapiens) |
|
GSE224901
|
RNA-seq |
21 |
Illumina NovaSeq 6000 (Homo sapiens) |
|
E GSE100400
|
Chip-seq;RNA-seq;4C_cccDNA |
31 |
Illumina NextSeq 500 (Homo sapiens);Illumina NextSeq 500 (Mus musculus) |
|
GSE173897
|
RNA-seq |
95 |
Illumina HiSeq 4000 (Homo sapiens) |
|
GSE262515
|
RNA-seq |
21 |
Illumina HiSeq 2500 (Homo sapiens);Illumina HiSeq 2500 (Mus musculus) |
|
GSE110345
|
RNA-seq |
4 |
Illumina HiSeq 2500 (Homo sapiens) |
|
C GSE131257
|
ATAC-seq;RNA-seq |
19 |
Illumina HiSeq 2500 (Homo sapiens) |
|
GSE94660
|
RNA-seq |
42 |
Illumina HiSeq 2500 (Homo sapiens) |
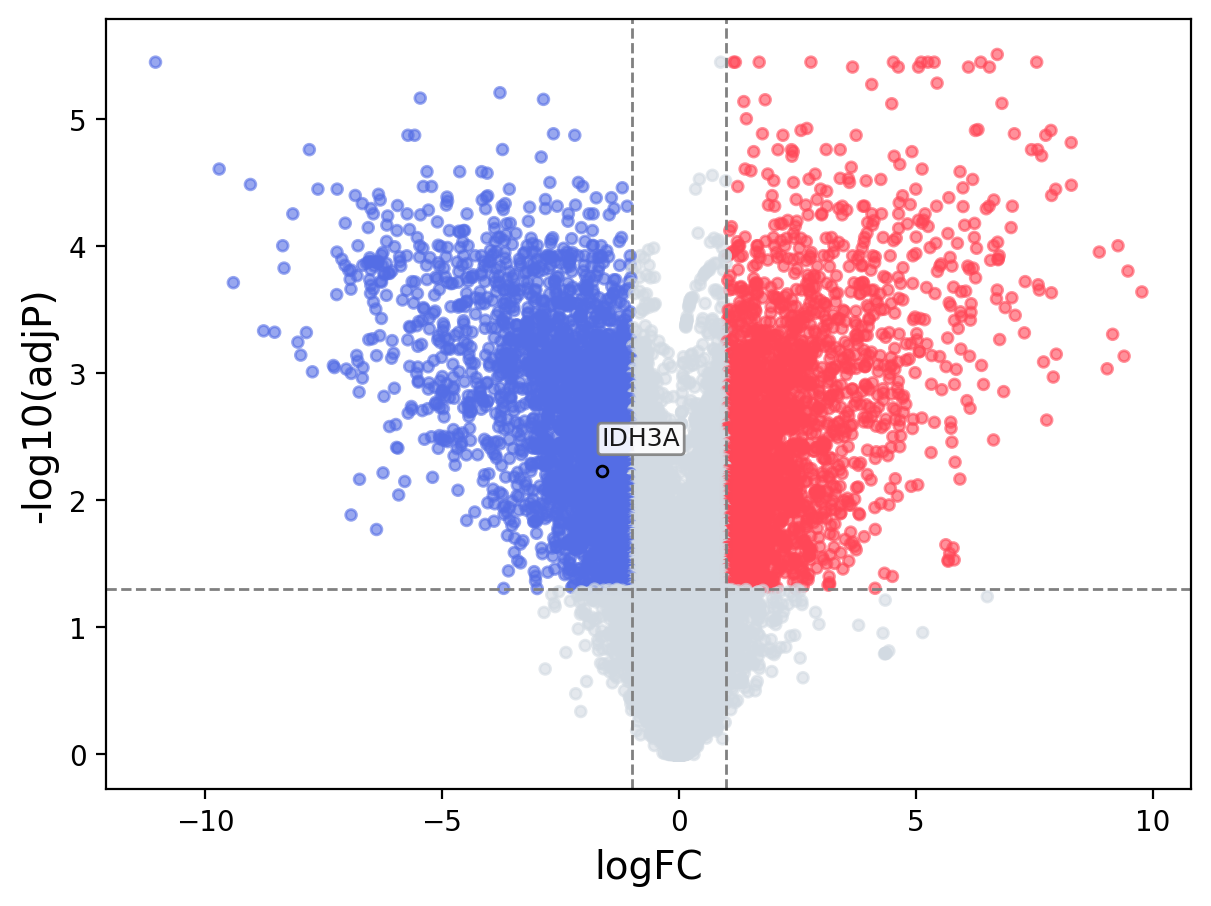
When the query gene is differentially changed in the dataset, a volcano/bar plot will be displayed.
> Dataset: GSE100400 - IDH3A expression across samples
|
Volcano Plot
|
Bar Plot
|
|
|
