Gene Information
|
Gene Name
|
INPP5D |
|
Gene ID
|
3635
|
|
Gene Full Name
|
inositol polyphosphate-5-phosphatase D |
|
Gene Alias
|
SHIP|SHIP-1|SHIP1|SIP-145|hp51CN|p150Ship |
|
Transcripts
|
ENSG00000168918
|
|
Virus
|
HTLV1 |
|
Gene Type
|
protein-coding |
|
HPA Location Info
|
Cytosol; 
|
|
Membrane Info
|
Enzymes, Metabolic proteins, Plasma proteins, Predicted intracellular proteins |
|
Uniport_ID
|
Q92835
|
|
HGNC ID
|
HGNC:6079
|
|
OMIM ID
|
601582 |
|
Summary
|
This gene is a member of the inositol polyphosphate-5-phosphatase (INPP5) family and encodes a protein with an N-terminal SH2 domain, an inositol phosphatase domain, and two C-terminal protein interaction domains. Expression of this protein is restricted to hematopoietic cells where its movement from the cytosol to the plasma membrane is mediated by tyrosine phosphorylation. At the plasma membrane, the protein hydrolyzes the 5' phosphate from phosphatidylinositol (3,4,5)-trisphosphate and inositol-1,3,4,5-tetrakisphosphate, thereby affecting multiple signaling pathways. The protein is also partly localized to the nucleus, where it may be involved in nuclear inositol phosphate signaling processes. Overall, the protein functions as a negative regulator of myeloid cell proliferation and survival. Mutations in this gene are associated with defects and cancers of the immune system. Deficiencies in the encoded protein, SHIP1, have been associated with Inflammatory Bowel Disease types such as Crohn's Disease and Ulcerative Colitis. Alternative splicing of this gene results in multiple transcript variants. [provided by RefSeq, Jul 2020] |
Target gene [INPP5D] related to VISs 
Integration Table: if previous studies reported that target gene was altered by virus integration events, the overlap between VISs in this literature and Cistrome factors was listed in this section
| DVID |
Chromosome |
HM |
TFBS |
CA |
Sum of Overlapped Records |
Detail |
| 6008017 |
chr2 |
9 |
35 |
5 |
49 |
View |
| 6013869 |
chr2 |
10 |
6 |
2 |
18 |
View |
Target gene [INPP5D] related to Omics data
| Data ID |
Experiment type |
Sample number |
Platform |
|
GSE189602
|
Methylation profiling (Array) |
4 |
Infinium MethylationEPIC |
|
C GSE94732
|
Chip-seq |
24 |
Illumina NextSeq 500 (Homo sapiens);illumina Genome Analyzer IIx (Homo sapiens) |
|
GSE52244
|
Expression array |
15 |
[HuEx-1_0-st] Affymetrix Human Exon 1.0 ST Array [probe set (exon) version] |
|
GSE19080
|
Expression array |
38 |
Homo sapiens 3K Immunoarray2 HTLV-1 JH |
|
GSE10789
|
Expression array |
6 |
NCI/ATC Hs-OperonV3 |
|
GSE168557
|
Expression array |
6 |
Agilent-039494 SurePrint G3 Human GE v2 8x60K Microarray 039381 (Feature Number version) |
|
GSE136189
|
Methylation profiling (Array) |
40 |
Illumina HumanMethylation450 BeadChip (HumanMethylation450_15017482);Illumina Infinium HumanMethylation850 BeadChip |
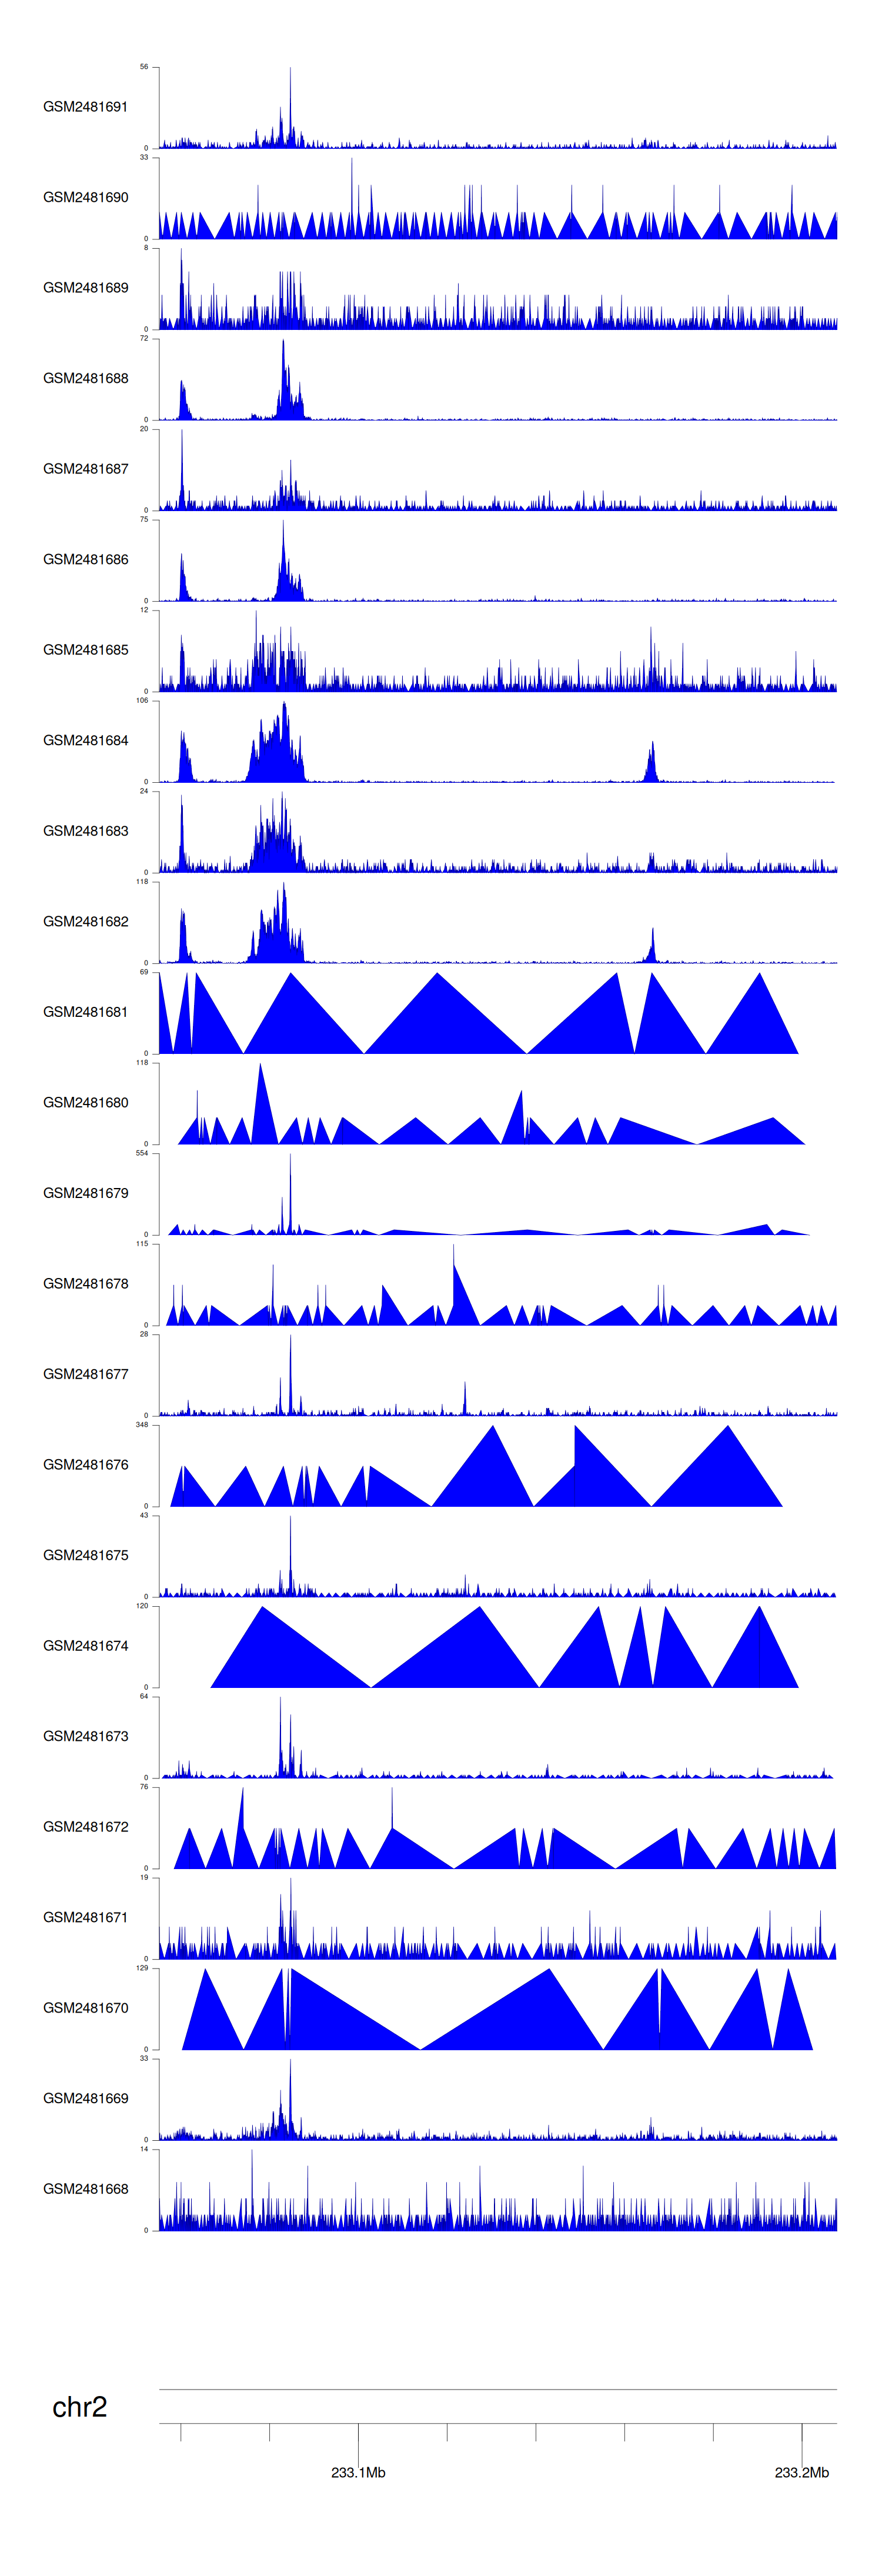
When the gene can detect a peak in the dataset, a peak plot will be displayed.
> Dataset: GSE94732 - INPP5D peak across samples
|
Peak Plot
|
|
|
