Gene Information
|
Gene Name
|
ME1 |
|
Gene ID
|
4199
|
|
Gene Full Name
|
malic enzyme 1 |
|
Gene Alias
|
HUMNDME|MES |
|
Transcripts
|
ENSG00000065833
|
|
Virus
|
HTLV1 |
|
Gene Type
|
protein-coding |
|
HPA Location Info
|
Nucleoplasm, Plasma membrane;Cytosol; 
|
|
Membrane Info
|
Enzymes, Metabolic proteins, Plasma proteins, Predicted intracellular proteins |
|
Uniport_ID
|
P48163
|
|
HGNC ID
|
HGNC:6983
|
|
OMIM ID
|
154250 |
|
Summary
|
This gene encodes a cytosolic, NADP-dependent enzyme that generates NADPH for fatty acid biosynthesis. The activity of this enzyme, the reversible oxidative decarboxylation of malate, links the glycolytic and citric acid cycles. The regulation of expression for this gene is complex. Increased expression can result from elevated levels of thyroid hormones or by higher proportions of carbohydrates in the diet. [provided by RefSeq, Jul 2008] |
Target gene [ME1] related to VISs 
Integration Table: if previous studies reported that target gene was altered by virus integration events, the overlap between VISs in this literature and Cistrome factors was listed in this section
| DVID |
Chromosome |
HM |
TFBS |
CA |
Sum of Overlapped Records |
Detail |
| 6024535 |
chr6 |
1 |
2 |
0 |
3 |
View |
Target gene [ME1] related to Omics data
| Data ID |
Experiment type |
Sample number |
Platform |
|
GSE189602
|
Methylation profiling (Array) |
4 |
Infinium MethylationEPIC |
|
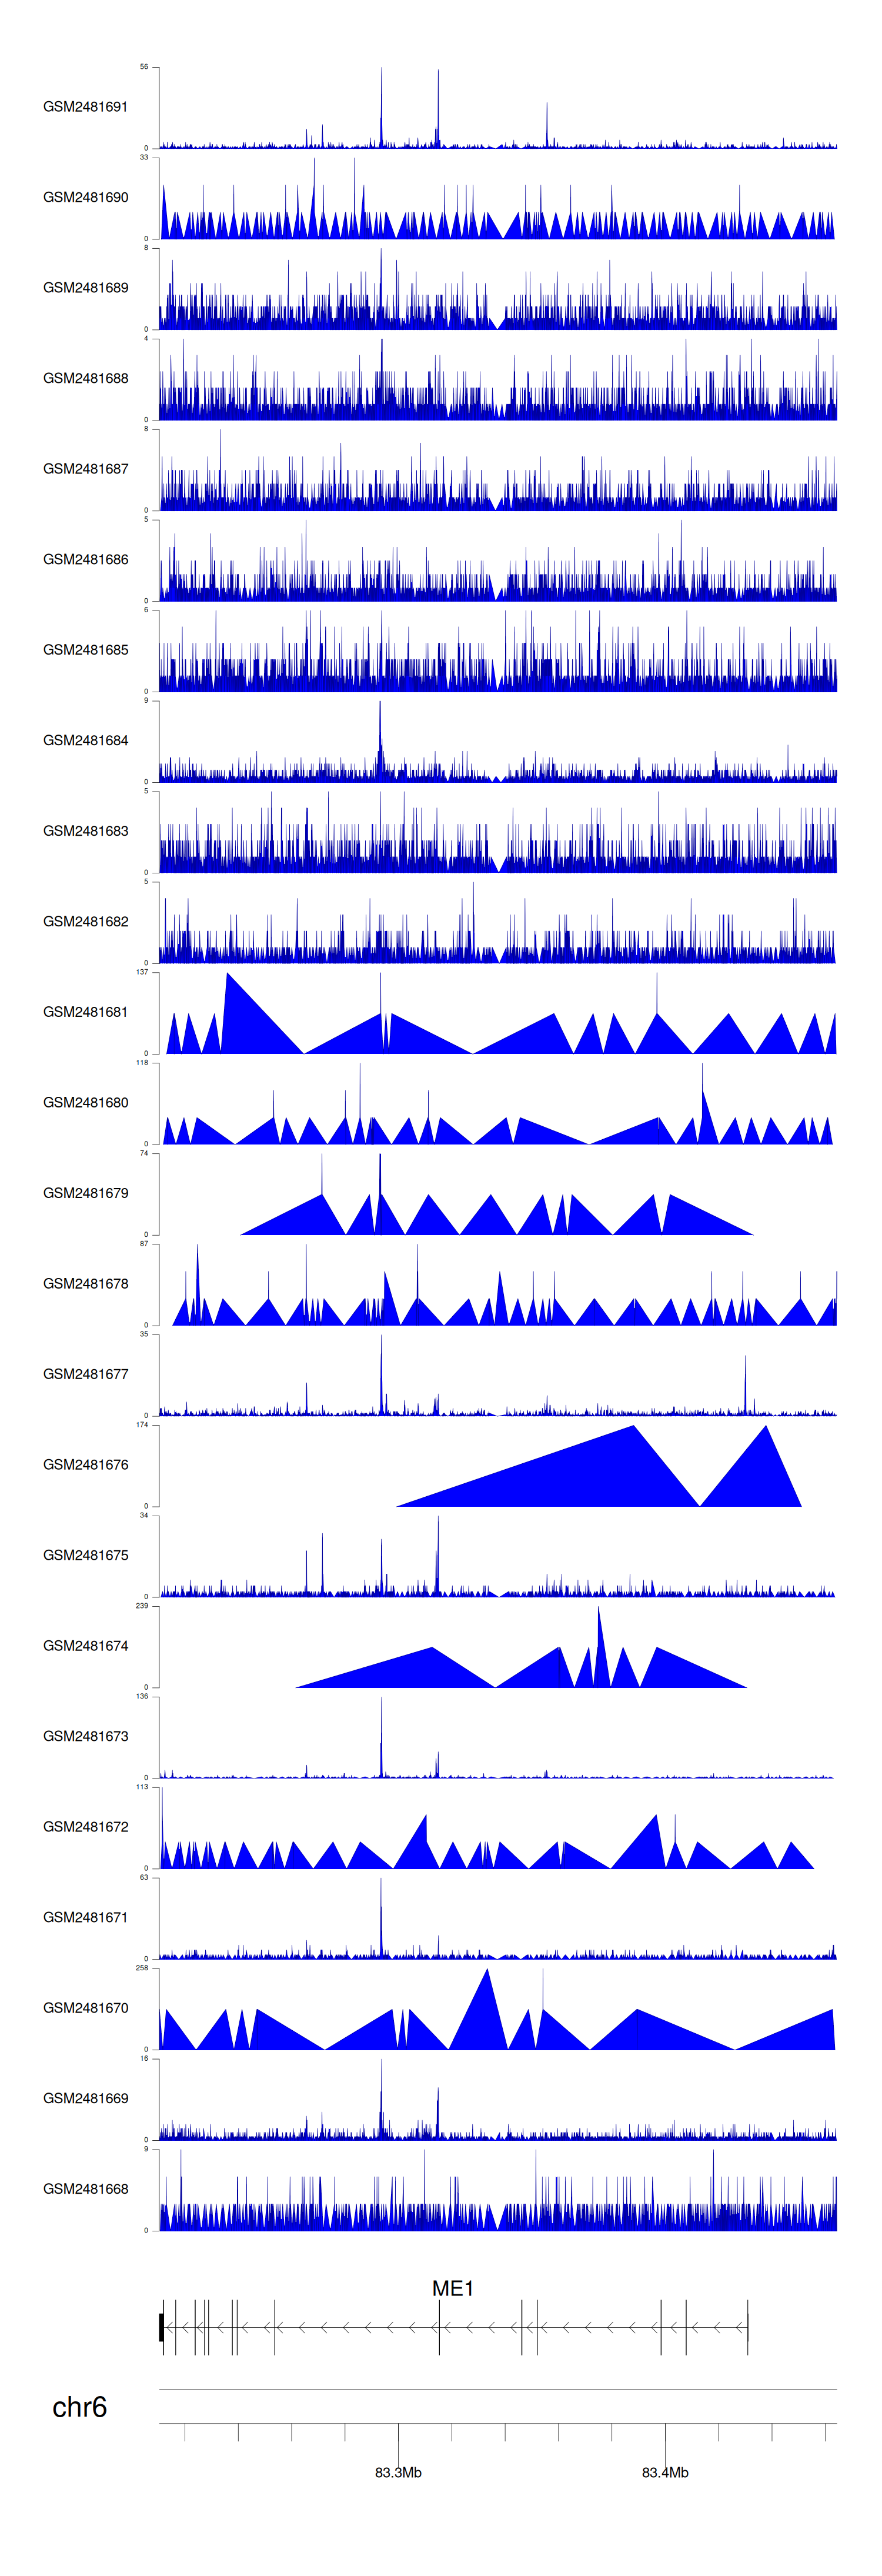
C GSE94732
|
Chip-seq |
24 |
Illumina NextSeq 500 (Homo sapiens);illumina Genome Analyzer IIx (Homo sapiens) |
|
GSE52244
|
Expression array |
15 |
[HuEx-1_0-st] Affymetrix Human Exon 1.0 ST Array [probe set (exon) version] |
|
GSE19080
|
Expression array |
38 |
Homo sapiens 3K Immunoarray2 HTLV-1 JH |
|
GSE10789
|
Expression array |
6 |
NCI/ATC Hs-OperonV3 |
|
GSE224047
|
RNA-seq |
10 |
Illumina NextSeq 500 (Homo sapiens) |
|
GSE168557
|
Expression array |
6 |
Agilent-039494 SurePrint G3 Human GE v2 8x60K Microarray 039381 (Feature Number version) |
|
GSE136189
|
Methylation profiling (Array) |
40 |
Illumina HumanMethylation450 BeadChip (HumanMethylation450_15017482);Illumina Infinium HumanMethylation850 BeadChip |
When the gene can detect a peak in the dataset, a peak plot will be displayed.
> Dataset: GSE94732 - ME1 peak across samples
|
Peak Plot
|
|
|
