Gene Information
|
Gene Name
|
NCL |
|
Gene ID
|
4691
|
|
Gene Full Name
|
nucleolin |
|
Gene Alias
|
C23|Nsr1 |
|
Transcripts
|
ENSG00000115053
|
|
Virus
|
HTLV1 |
|
Gene Type
|
protein-coding |
|
HPA Location Info
|
Nucleoplasm, Nucleoli, Nucleoli rim;Mitotic chromosome; 
|
|
Membrane Info
|
Plasma proteins, Predicted intracellular proteins |
|
Uniport_ID
|
P19338
|
|
HGNC ID
|
HGNC:7667
|
|
OMIM ID
|
164035 |
|
Summary
|
Nucleolin (NCL), a eukaryotic nucleolar phosphoprotein, is involved in the synthesis and maturation of ribosomes. It is located mainly in dense fibrillar regions of the nucleolus. Human NCL gene consists of 14 exons with 13 introns and spans approximately 11kb. The intron 11 of the NCL gene encodes a small nucleolar RNA, termed U20. [provided by RefSeq, Jul 2008] |
Target gene [NCL] related to VISs 
Integration Table: if previous studies reported that target gene was altered by virus integration events, the overlap between VISs in this literature and Cistrome factors was listed in this section
Target gene [NCL] related to Omics data
| Data ID |
Experiment type |
Sample number |
Platform |
|
GSE189602
|
Methylation profiling (Array) |
4 |
Infinium MethylationEPIC |
|
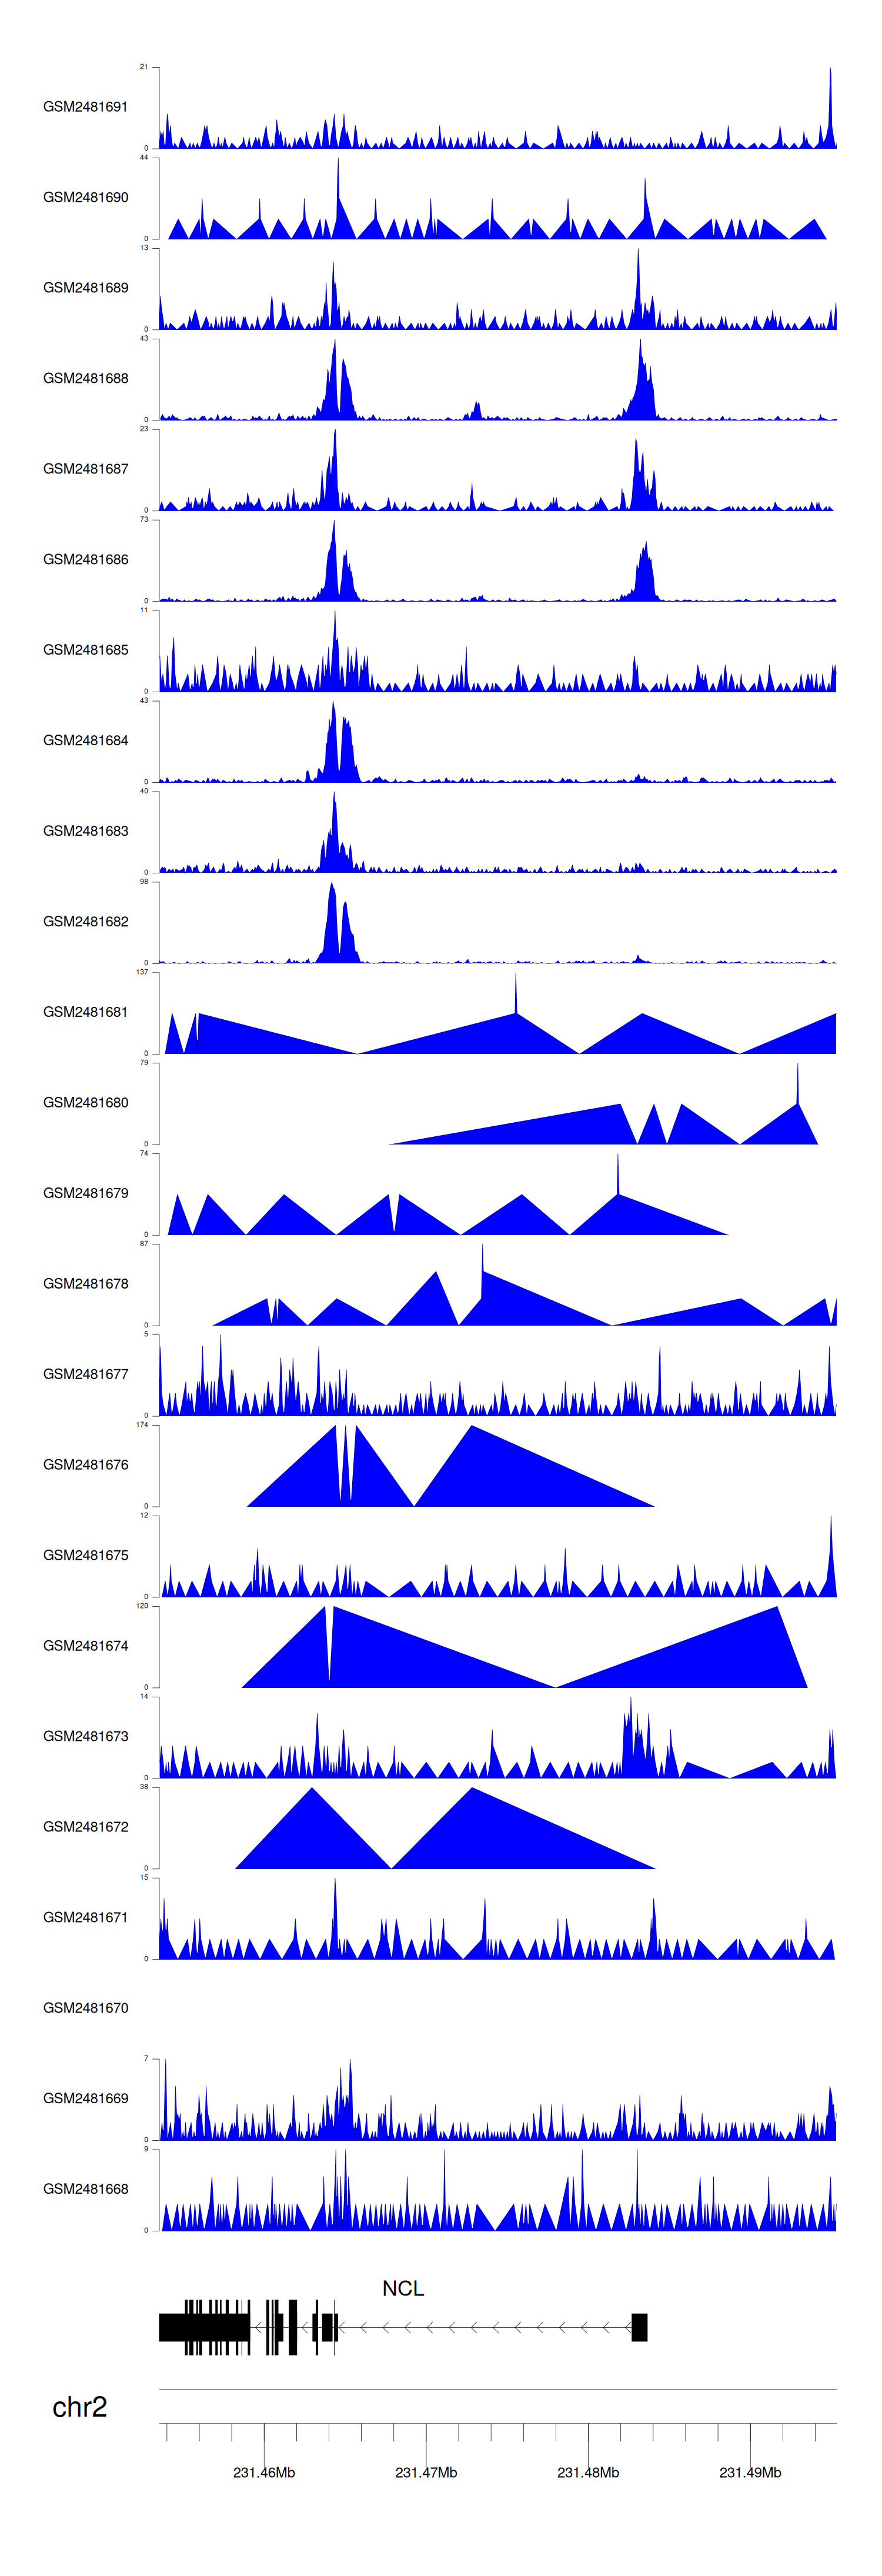
C GSE94732
|
Chip-seq |
24 |
Illumina NextSeq 500 (Homo sapiens);illumina Genome Analyzer IIx (Homo sapiens) |
|
GSE52244
|
Expression array |
15 |
[HuEx-1_0-st] Affymetrix Human Exon 1.0 ST Array [probe set (exon) version] |
|
GSE19080
|
Expression array |
38 |
Homo sapiens 3K Immunoarray2 HTLV-1 JH |
|
GSE10789
|
Expression array |
6 |
NCI/ATC Hs-OperonV3 |
|
GSE224047
|
RNA-seq |
10 |
Illumina NextSeq 500 (Homo sapiens) |
|
GSE168557
|
Expression array |
6 |
Agilent-039494 SurePrint G3 Human GE v2 8x60K Microarray 039381 (Feature Number version) |
|
GSE136189
|
Methylation profiling (Array) |
40 |
Illumina HumanMethylation450 BeadChip (HumanMethylation450_15017482);Illumina Infinium HumanMethylation850 BeadChip |
When the gene can detect a peak in the dataset, a peak plot will be displayed.
> Dataset: GSE94732 - NCL peak across samples
|
Peak Plot
|
|
|
