Gene Information
|
Gene Name
|
RPS29 |
|
Gene ID
|
6235
|
|
Gene Full Name
|
ribosomal protein S29 |
|
Gene Alias
|
DBA13|S29|uS14 |
|
Transcripts
|
ENSG00000213741
|
|
Virus
|
HBV |
|
Gene Type
|
protein-coding |
|
HPA Location Info
|
Endoplasmic reticulum, Cytosol; 
|
|
Membrane Info
|
Disease related genes, Human disease related genes, Predicted intracellular proteins, Ribosomal proteins |
|
Uniport_ID
|
P62273
|
|
HGNC ID
|
HGNC:10419
|
|
OMIM ID
|
603633 |
|
Summary
|
Ribosomes, the organelles that catalyze protein synthesis, consist of a small 40S subunit and a large 60S subunit. Together these subunits are composed of 4 RNA species and approximately 80 structurally distinct proteins. This gene encodes a ribosomal protein that is a component of the 40S subunit and a member of the S14P family of ribosomal proteins. The protein, which contains a C2-C2 zinc finger-like domain that can bind to zinc, can enhance the tumor suppressor activity of Ras-related protein 1A (KREV1). It is located in the cytoplasm. Variable expression of this gene in colorectal cancers compared to adjacent normal tissues has been observed, although no correlation between the level of expression and the severity of the disease has been found. As is typical for genes encoding ribosomal proteins, there are multiple processed pseudogenes of this gene dispersed through the genome. Alternatively spliced transcript variants encoding different isoforms have been found for this gene. [provided by RefSeq, Mar 2013] |
Target gene [RPS29] related to VISs 
Integration Table: if previous studies reported that target gene was altered by virus integration events, the overlap between VISs in this literature and Cistrome factors was listed in this section
| DVID |
Chromosome |
HM |
TFBS |
CA |
Sum of Overlapped Records |
Detail |
| 1004474 |
chr14 |
64 |
13 |
2 |
79 |
View |
Target gene [RPS29] related to Omics data
| Data ID |
Experiment type |
Sample number |
Platform |
|
S GSE252863
|
scRNA-seq |
10 |
Illumina HiSeq 2500 (Homo sapiens) |
|
GSE236281
|
RNA-seq |
12 |
Illumina MiSeq (Homo sapiens) |
|
C GSE35465
|
Chip-seq;RNA-seq |
6 |
Illumina HiSeq 2000 (Homo sapiens) |
|
S GSE199850
|
scRNA-seq |
1 |
HiSeq X Ten (Homo sapiens) |
|
C GSE68402
|
Chip-seq |
26 |
Illumina MiSeq (Homo sapiens);Illumina HiSeq 2500 (Homo sapiens) |
|
S GSE247322
|
scRNA-seq |
27 |
Illumina NovaSeq 6000 (Homo sapiens) |
|
TCGA_LIHC_HBV
|
DNA methylation sequencing;RNA-seq |
97 |
TCGA |
|
C GSE270130
|
Chip-seq |
27 |
Illumina NovaSeq 6000 (Homo sapiens) |
|
GSE224901
|
RNA-seq |
21 |
Illumina NovaSeq 6000 (Homo sapiens) |
|
E GSE100400
|
Chip-seq;RNA-seq;4C_cccDNA |
31 |
Illumina NextSeq 500 (Homo sapiens);Illumina NextSeq 500 (Mus musculus) |
|
GSE173897
|
RNA-seq |
95 |
Illumina HiSeq 4000 (Homo sapiens) |
|
GSE262515
|
RNA-seq |
21 |
Illumina HiSeq 2500 (Homo sapiens);Illumina HiSeq 2500 (Mus musculus) |
|
GSE110345
|
RNA-seq |
4 |
Illumina HiSeq 2500 (Homo sapiens) |
|
C GSE131257
|
ATAC-seq;RNA-seq |
19 |
Illumina HiSeq 2500 (Homo sapiens) |
|
GSE94660
|
RNA-seq |
42 |
Illumina HiSeq 2500 (Homo sapiens) |
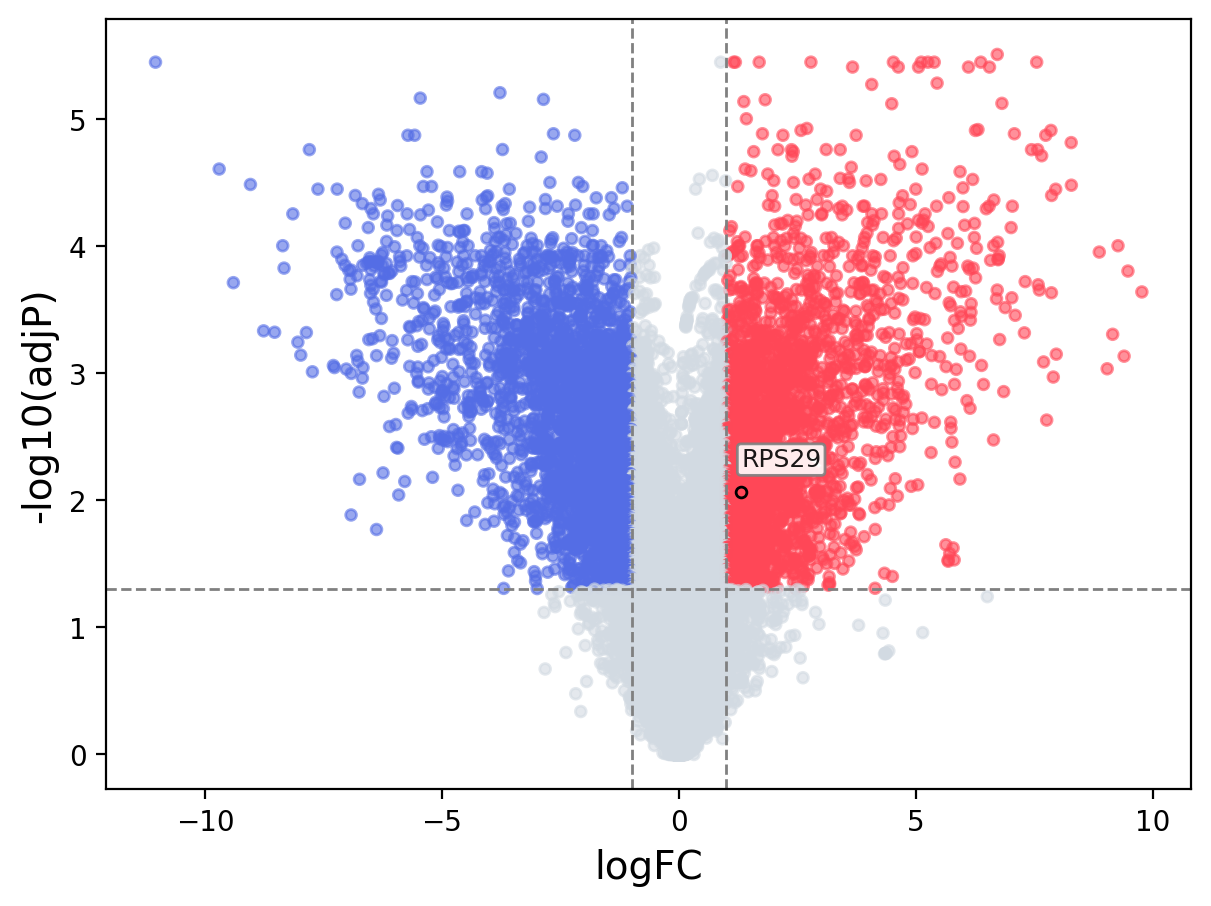
When the query gene is differentially changed in the dataset, a volcano/bar plot will be displayed.
> Dataset: GSE100400 - RPS29 expression across samples
|
Volcano Plot
|
Bar Plot
|
|
|
