Gene Information
|
Gene Name
|
SPTB |
|
Gene ID
|
6710
|
|
Gene Full Name
|
spectrin beta, erythrocytic |
|
Gene Alias
|
EL3|HS2|HSPTB1|SPH2 |
|
Transcripts
|
ENSG00000070182
|
|
Virus
|
HTLV1 |
|
Gene Type
|
protein-coding |
|
HPA Location Info
|
Cytosol; 
|
|
Membrane Info
|
Disease related genes, Human disease related genes, Plasma proteins, Predicted intracellular proteins |
|
Uniport_ID
|
P11277
|
|
HGNC ID
|
HGNC:11274
|
|
OMIM ID
|
182870 |
|
Summary
|
This locus encodes a member of the spectrin gene family. Spectrin proteins, along with ankyrin, play a role in cell membrane organization and stability. The protein encoded by this locus functions in stability of erythrocyte membranes, and mutations in this gene have been associated with spherocytosis type 2, hereditary elliptocytosis, and neonatal hemolytic anemia. Alternatively spliced transcript variants have been described. [provided by RefSeq, Nov 2009] |
Target gene [SPTB] related to VISs 
Integration Table: if previous studies reported that target gene was altered by virus integration events, the overlap between VISs in this literature and Cistrome factors was listed in this section
| DVID |
Chromosome |
HM |
TFBS |
CA |
Sum of Overlapped Records |
Detail |
| 6000820 |
chr14 |
576 |
161 |
79 |
816 |
View |
Target gene [SPTB] related to Omics data
| Data ID |
Experiment type |
Sample number |
Platform |
|
GSE189602
|
Methylation profiling (Array) |
4 |
Infinium MethylationEPIC |
|
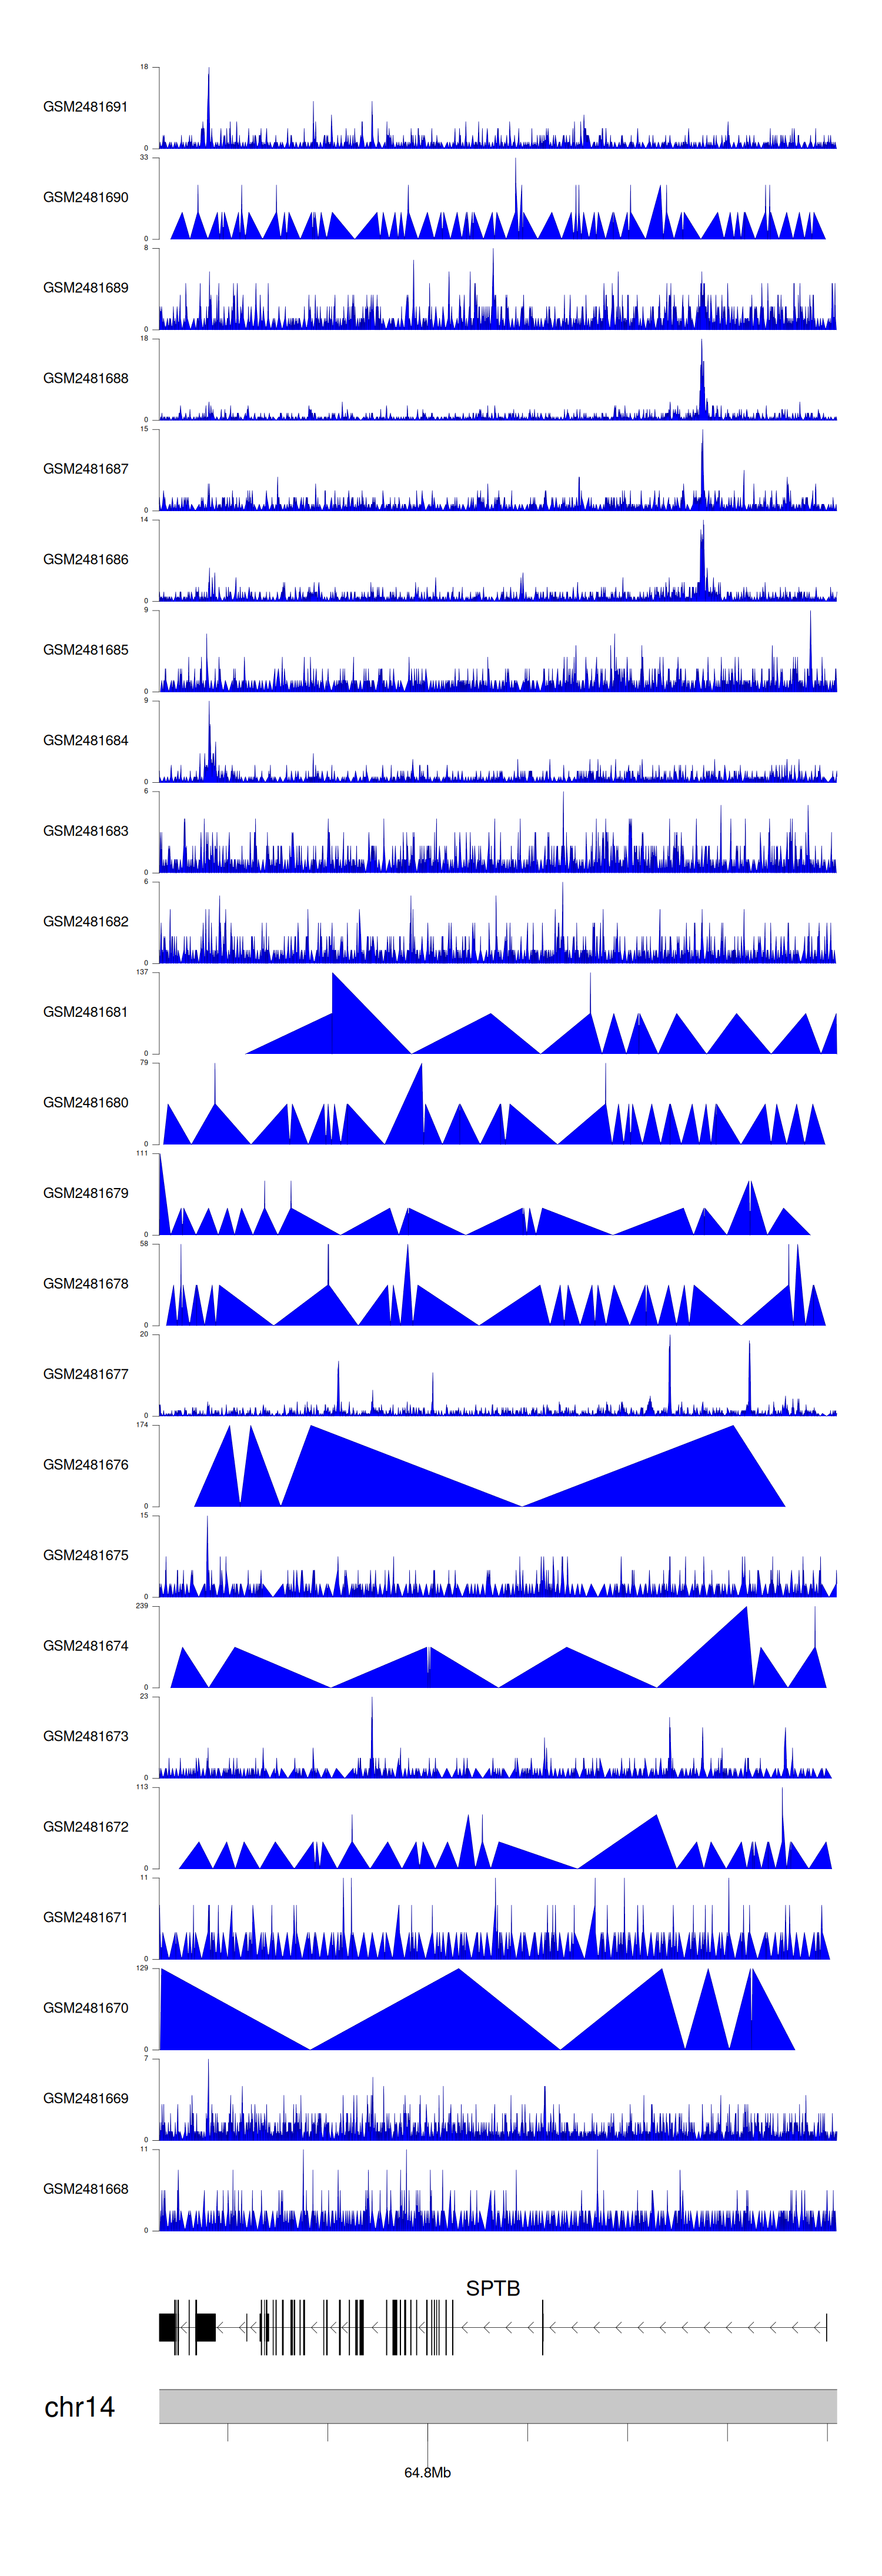
C GSE94732
|
Chip-seq |
24 |
Illumina NextSeq 500 (Homo sapiens);illumina Genome Analyzer IIx (Homo sapiens) |
|
GSE52244
|
Expression array |
15 |
[HuEx-1_0-st] Affymetrix Human Exon 1.0 ST Array [probe set (exon) version] |
|
GSE19080
|
Expression array |
38 |
Homo sapiens 3K Immunoarray2 HTLV-1 JH |
|
GSE10789
|
Expression array |
6 |
NCI/ATC Hs-OperonV3 |
|
GSE224047
|
RNA-seq |
10 |
Illumina NextSeq 500 (Homo sapiens) |
|
GSE168557
|
Expression array |
6 |
Agilent-039494 SurePrint G3 Human GE v2 8x60K Microarray 039381 (Feature Number version) |
|
GSE136189
|
Methylation profiling (Array) |
40 |
Illumina HumanMethylation450 BeadChip (HumanMethylation450_15017482);Illumina Infinium HumanMethylation850 BeadChip |
When the gene can detect a peak in the dataset, a peak plot will be displayed.
> Dataset: GSE94732 - SPTB peak across samples
|
Peak Plot
|
|
|
