Gene Information
|
Gene Name
|
TTN |
|
Gene ID
|
7273
|
|
Gene Full Name
|
titin |
|
Gene Alias
|
CMD1G|CMH9|CMPD4|CMYO5|CMYP5|EOMFC|HMERF|LGMD2J|LGMDR10|MYLK5|SALMY|TMD |
|
Transcripts
|
ENSG00000155657
|
|
Virus
|
HTLV1 |
|
Gene Type
|
protein-coding |
|
HPA Location Info
|

|
|
Membrane Info
|
Disease related genes, Enzymes, Human disease related genes, Plasma proteins, Potential drug targets, Predicted intracellular proteins, Predicted membrane proteins |
|
Uniport_ID
|
Q8WZ42
|
|
HGNC ID
|
HGNC:12403
|
|
OMIM ID
|
188840 |
|
Summary
|
This gene encodes a large abundant protein of striated muscle. The product of this gene is divided into two regions, a N-terminal I-band and a C-terminal A-band. The I-band, which is the elastic part of the molecule, contains two regions of tandem immunoglobulin domains on either side of a PEVK region that is rich in proline, glutamate, valine and lysine. The A-band, which is thought to act as a protein-ruler, contains a mixture of immunoglobulin and fibronectin repeats, and possesses kinase activity. An N-terminal Z-disc region and a C-terminal M-line region bind to the Z-line and M-line of the sarcomere, respectively, so that a single titin molecule spans half the length of a sarcomere. Titin also contains binding sites for muscle associated proteins so it serves as an adhesion template for the assembly of contractile machinery in muscle cells. It has also been identified as a structural protein for chromosomes. Alternative splicing of this gene results in multiple transcript variants. Considerable variability exists in the I-band, the M-line and the Z-disc regions of titin. Variability in the I-band region contributes to the differences in elasticity of different titin isoforms and, therefore, to the differences in elasticity of different muscle types. Mutations in this gene are associated with familial hypertrophic cardiomyopathy 9, and autoantibodies to titin are produced in patients with the autoimmune disease scleroderma. [provided by RefSeq, Feb 2012] |
Target gene [TTN] related to VISs 
Integration Table: if previous studies reported that target gene was altered by virus integration events, the overlap between VISs in this literature and Cistrome factors was listed in this section
| DVID |
Chromosome |
HM |
TFBS |
CA |
Sum of Overlapped Records |
Detail |
| 6014184 |
chr2 |
17 |
0 |
0 |
17 |
View |
Target gene [TTN] related to Omics data
| Data ID |
Experiment type |
Sample number |
Platform |
|
GSE189602
|
Methylation profiling (Array) |
4 |
Infinium MethylationEPIC |
|
C GSE94732
|
Chip-seq |
24 |
Illumina NextSeq 500 (Homo sapiens);illumina Genome Analyzer IIx (Homo sapiens) |
|
GSE52244
|
Expression array |
15 |
[HuEx-1_0-st] Affymetrix Human Exon 1.0 ST Array [probe set (exon) version] |
|
GSE19080
|
Expression array |
38 |
Homo sapiens 3K Immunoarray2 HTLV-1 JH |
|
GSE10789
|
Expression array |
6 |
NCI/ATC Hs-OperonV3 |
|
GSE224047
|
RNA-seq |
10 |
Illumina NextSeq 500 (Homo sapiens) |
|
GSE168557
|
Expression array |
6 |
Agilent-039494 SurePrint G3 Human GE v2 8x60K Microarray 039381 (Feature Number version) |
|
GSE136189
|
Methylation profiling (Array) |
40 |
Illumina HumanMethylation450 BeadChip (HumanMethylation450_15017482);Illumina Infinium HumanMethylation850 BeadChip |
When the gene can detect a peak in the dataset, a peak plot will be displayed.
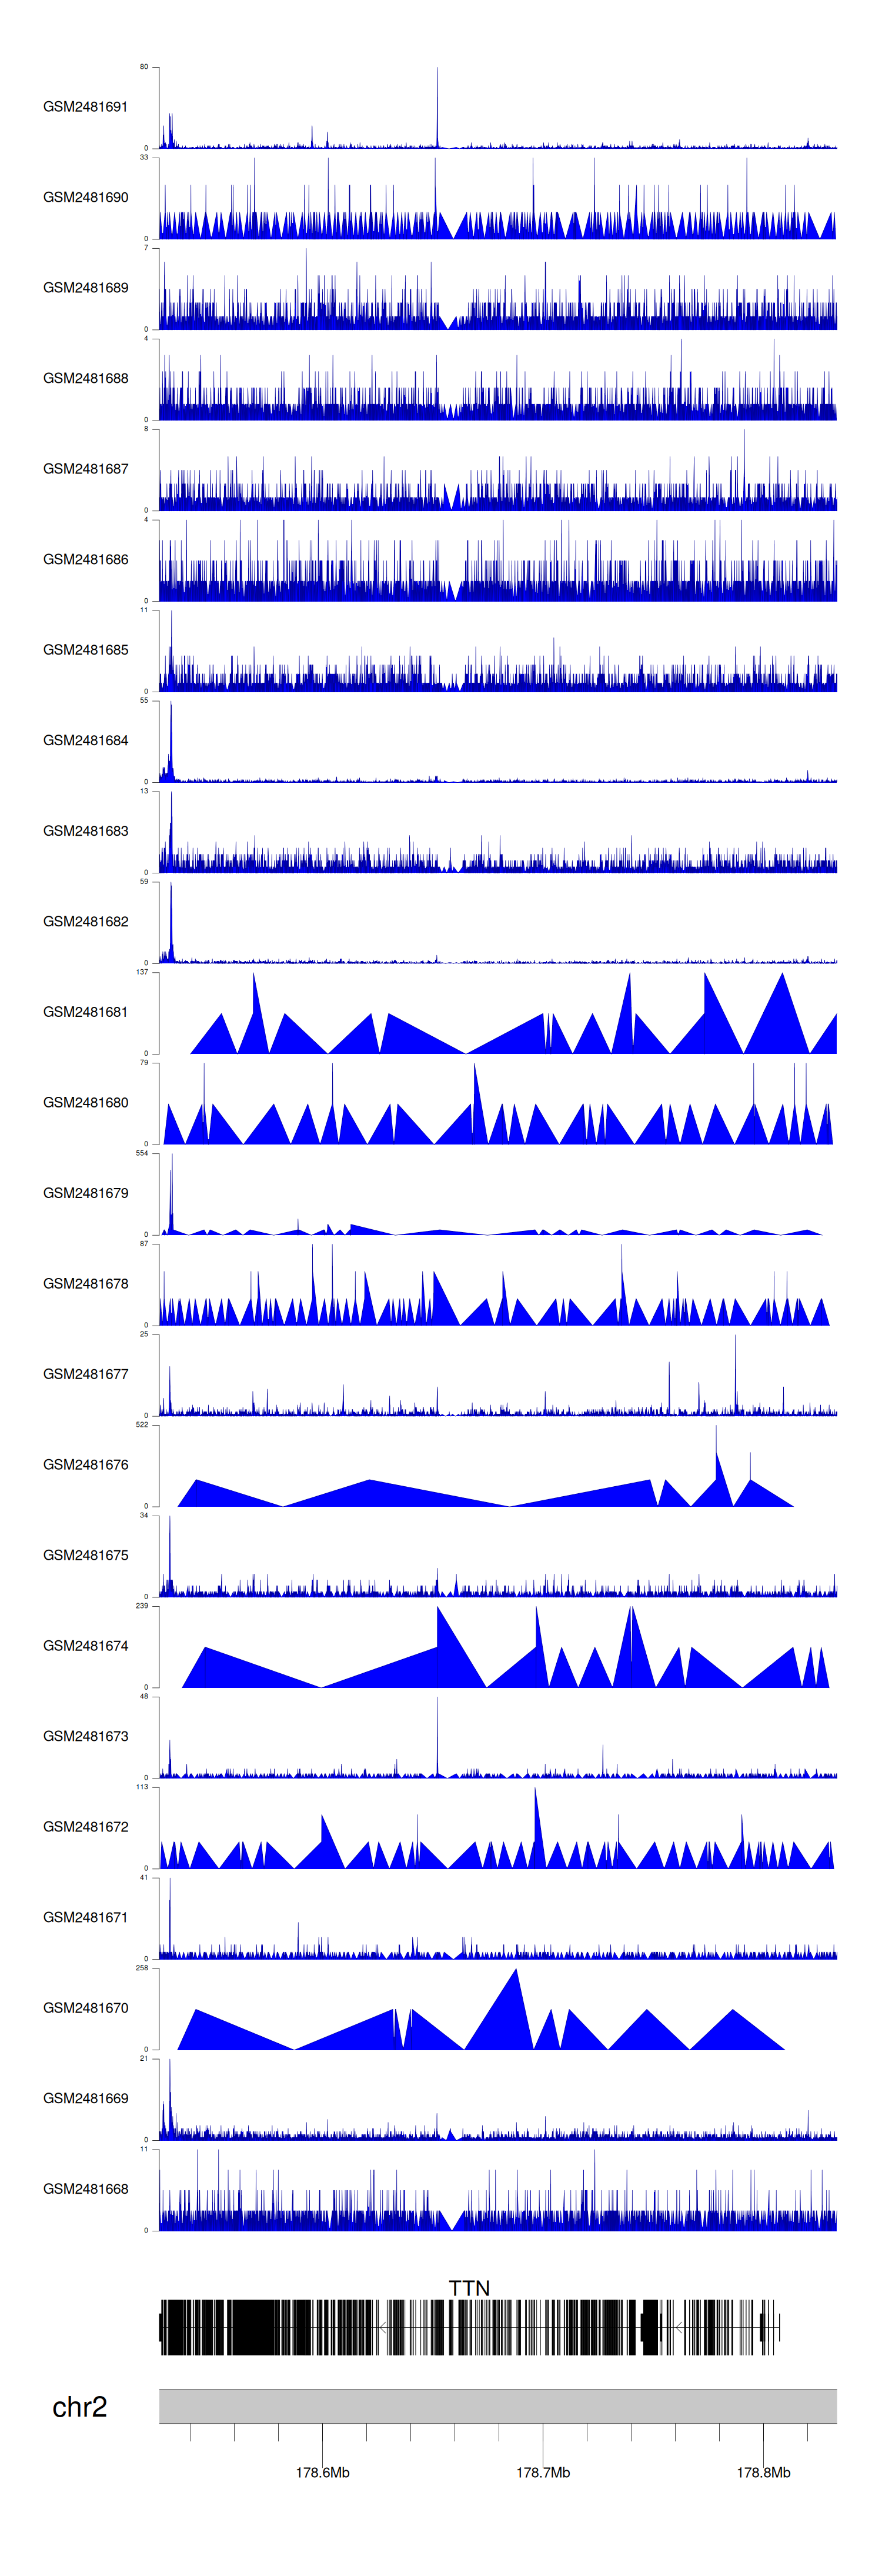
> Dataset: GSE94732 - TTN peak across samples
|
Peak Plot
|
|
|
