Gene Information
|
Gene Name
|
CLDN16 |
|
Gene ID
|
10686
|
|
Gene Full Name
|
claudin 16 |
|
Gene Alias
|
HOMG3|PCLN1 |
|
Transcripts
|
ENSG00000113946
|
|
Virus
|
HPV |
|
Gene Type
|
protein-coding |
|
HPA Location Info
|

|
|
Membrane Info
|
Disease related genes, Human disease related genes, Potential drug targets, Predicted membrane proteins, Transporters |
|
Uniport_ID
|
Q9Y5I7
|
|
HGNC ID
|
HGNC:2037
|
|
OMIM ID
|
603959 |
|
Summary
|
Tight junctions represent one mode of cell-to-cell adhesion in epithelial or endothelial cell sheets, forming continuous seals around cells and serving as a physical barrier to prevent solutes and water from passing freely through the paracellular space. These junctions are comprised of sets of continuous networking strands in the outwardly facing cytoplasmic leaflet, with complementary grooves in the inwardly facing extracytoplasmic leaflet. The protein encoded by this gene, a member of the claudin family, is an integral membrane protein and a component of tight junction strands. It is found primarily in the kidneys, specifically in the thick ascending limb of Henle, where it acts as either an intercellular pore or ion concentration sensor to regulate the paracellular resorption of magnesium ions. Defects in this gene are a cause of primary hypomagnesemia, which is characterized by massive renal magnesium wasting with hypomagnesemia and hypercalciuria, resulting in nephrocalcinosis and renal failure. This gene and the CLDN1 gene are clustered on chromosome 3q28. [provided by RefSeq, Jun 2010] |
Target gene [CLDN16] related to VISs 
Integration Table: if previous studies reported that target gene was altered by virus integration events, the overlap between VISs in this literature and Cistrome factors was listed in this section
Target gene [CLDN16] related to Omics data
| Data ID |
Experiment type |
Sample number |
Platform |
|
C GSE183048
|
Chip-seq |
24 |
Illumina HiSeq 4000 (Homo sapiens) |
|
GSE169622
|
Methylation profiling (Array) |
9 |
Infinium MethylationEPIC |
|
GSE65858
|
Expression array |
270 |
Illumina HumanHT-12 V4.0 expression beadchip |
|
GSE181805
|
Expression array |
25 |
[HTA-2_0] Affymetrix Human Transcriptome Array 2.0 [transcript (gene) version] |
|
GSE196215
|
RNA-seq |
8 |
Illumina NovaSeq 6000 (Homo sapiens) |
|
GSE140662
|
Expression array |
8 |
[HTA-2_0] Affymetrix Human Transcriptome Array 2.0 [transcript (gene) version] |
|
GSE55542
|
Expression array |
36 |
Agilent-039494 SurePrint G3 Human GE v2 8x60K Microarray 039381 (Probe Name version) |
|
C GSE143026
|
ATAC-seq;Chip-seq;RNA-seq |
30 |
Illumina HiSeq 2500 (Homo sapiens) |
|
M TCGA_CESC
|
DNA methylation sequencing;RNA-seq |
288 |
TCGA |
|
GSE51993
|
Expression array |
48 |
Illumina Human v2 MicroRNA expression beadchip;Illumina HumanHT-12 V4.0 expression beadchip |
|
GSE55550
|
Expression array |
155 |
Agilent-039494 SurePrint G3 Human GE v2 8x60K Microarray 039381 (Probe Name version) |
|
GSE165883
|
RNA-seq |
20 |
Illumina NextSeq 500 (Homo sapiens) |
When the query gene is differentially changed in the dataset, a volcano/bar plot will be displayed.
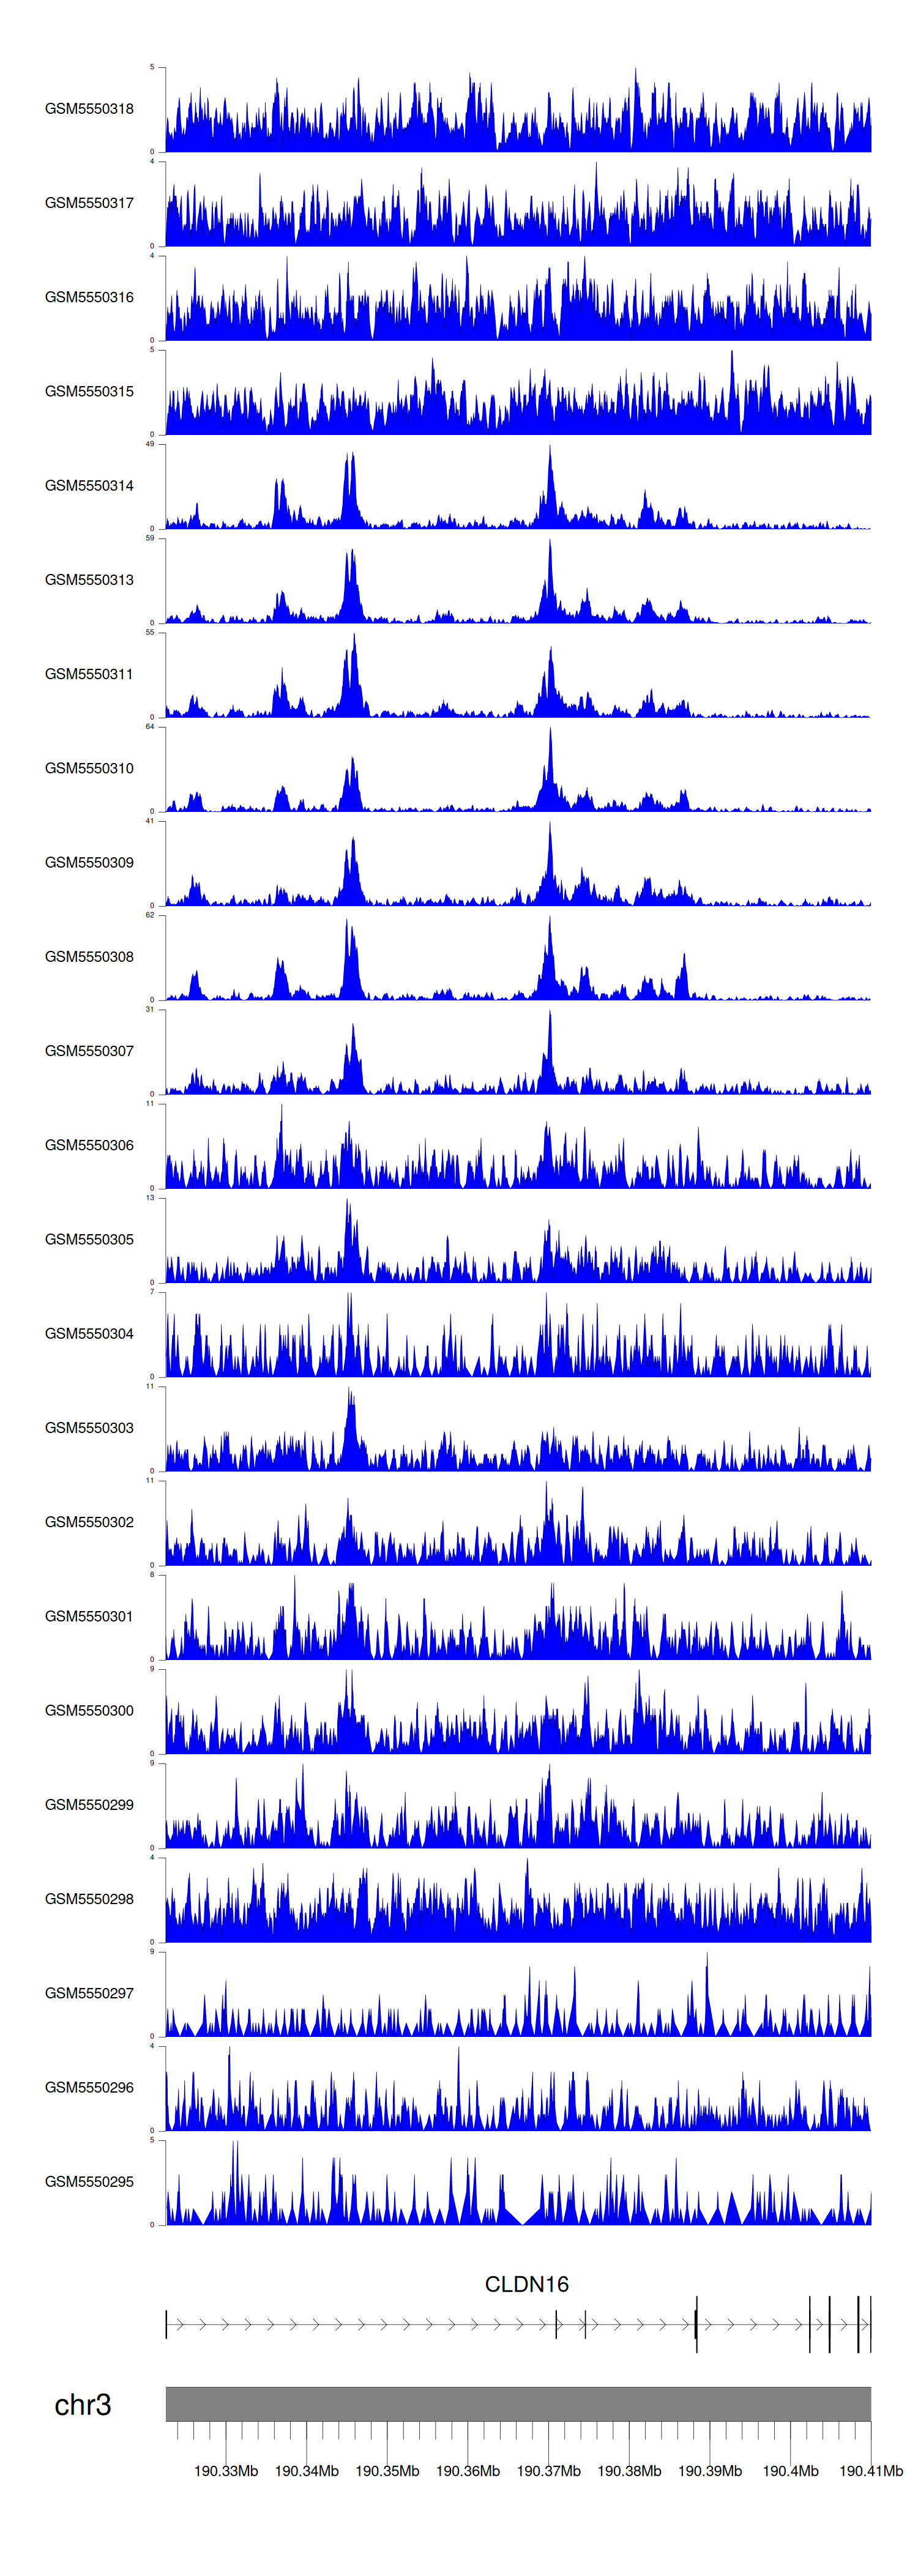
> Dataset: GSE183048 - CLDN16 peak across samples
|
Peak Plot
|
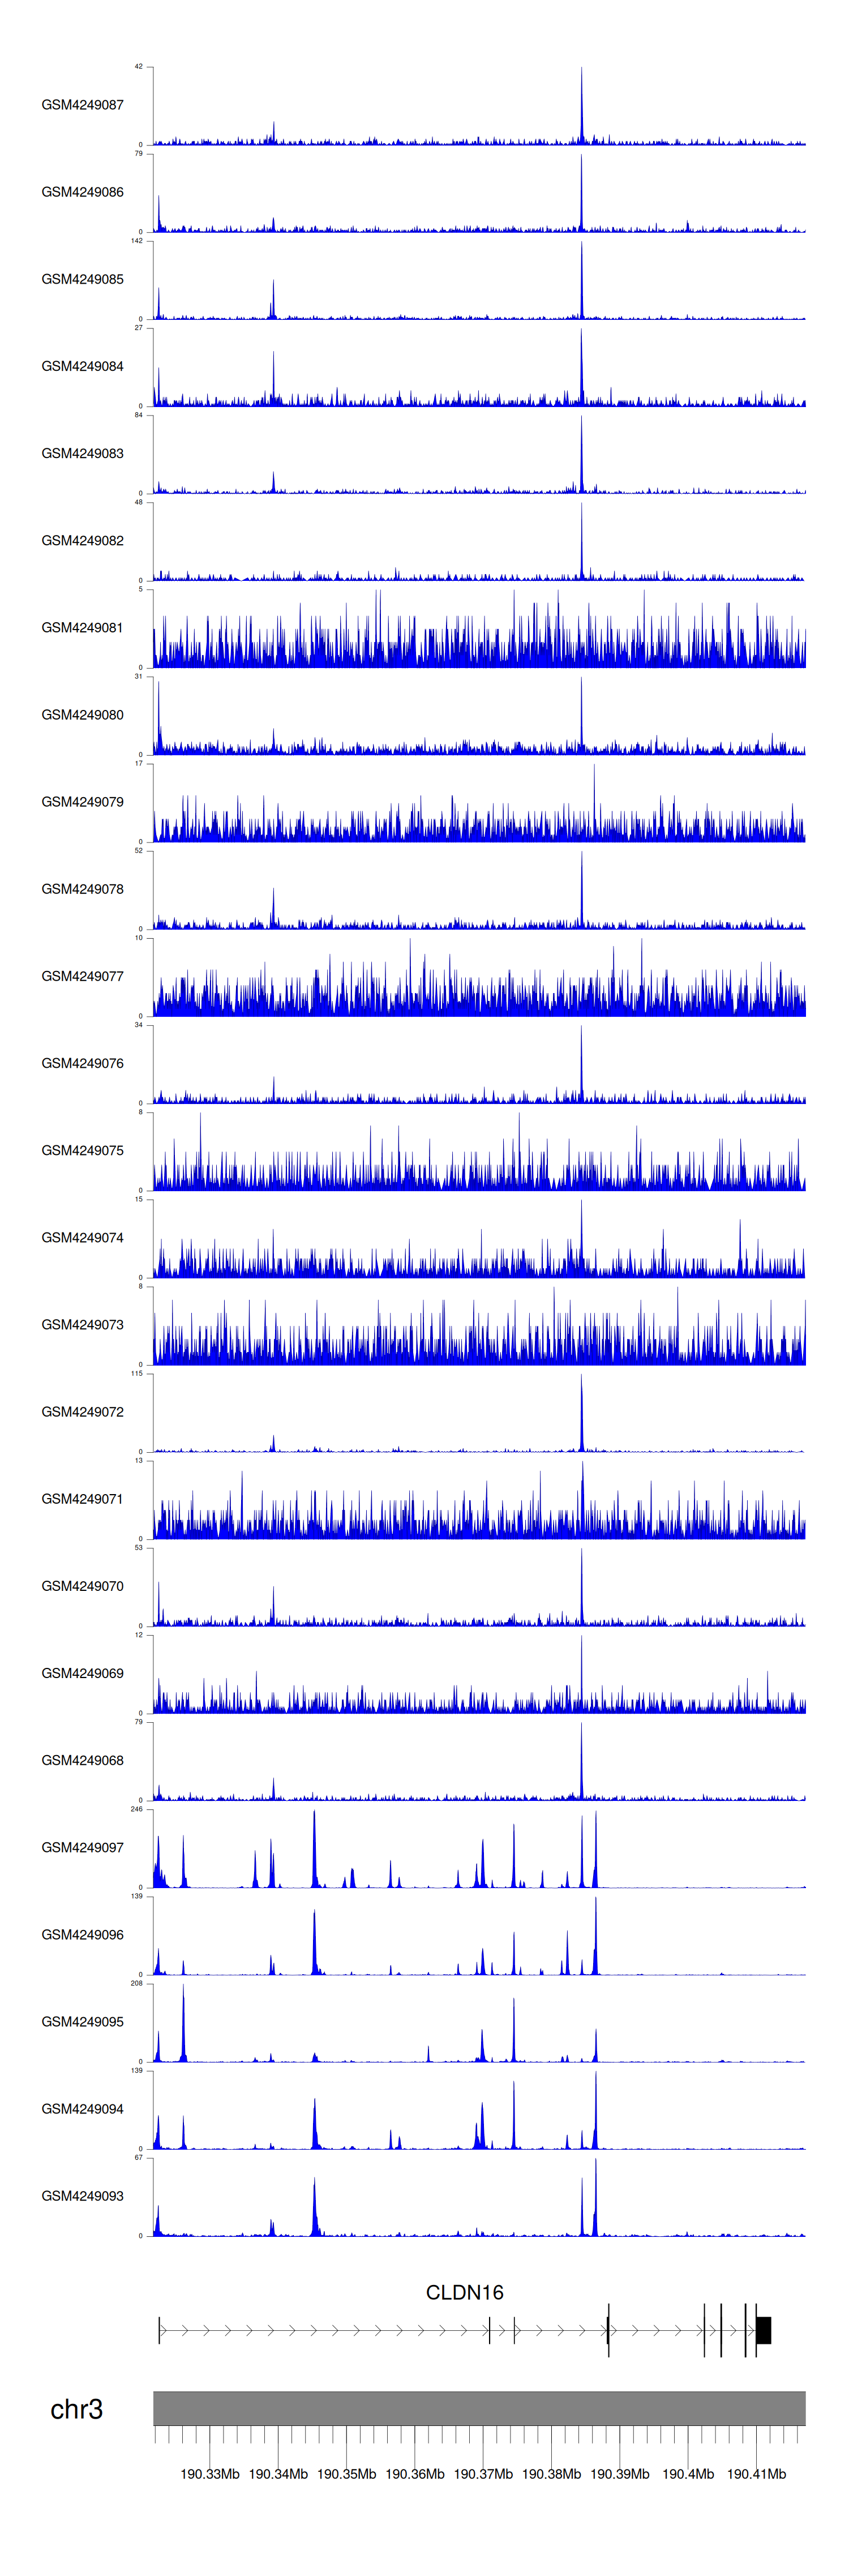
> Dataset: GSE143026 - CLDN16 peak across samples
|
Peak Plot
|
|
|
