Gene Information
|
Gene Name
|
STAT3 |
|
Gene ID
|
6774
|
|
Gene Full Name
|
signal transducer and activator of transcription 3 |
|
Gene Alias
|
ADMIO|ADMIO1|APRF|HIES |
|
Transcripts
|
ENSG00000168610
|
|
Virus
|
HBV |
|
Gene Type
|
protein-coding |
|
HPA Location Info
|
Nucleoplasm, Cytosol; 
|
|
Membrane Info
|
Cancer-related genes, Disease related genes, Human disease related genes, Plasma proteins, Predicted intracellular proteins, Transcription factors |
|
Uniport_ID
|
P40763
|
|
HGNC ID
|
HGNC:11364
|
|
OMIM ID
|
102582 |
|
Summary
|
The protein encoded by this gene is a member of the STAT protein family. In response to cytokines and growth factors, STAT family members are phosphorylated by the receptor associated kinases, and then form homo- or heterodimers that translocate to the cell nucleus where they act as transcription activators. This protein is activated through phosphorylation in response to various cytokines and growth factors including IFNs, EGF, IL5, IL6, HGF, LIF and BMP2. This protein mediates the expression of a variety of genes in response to cell stimuli, and thus plays a key role in many cellular processes such as cell growth and apoptosis. The small GTPase Rac1 has been shown to bind and regulate the activity of this protein. PIAS3 protein is a specific inhibitor of this protein. This gene also plays a role in regulating host response to viral and bacterial infections. Mutations in this gene are associated with infantile-onset multisystem autoimmune disease and hyper-immunoglobulin E syndrome. [provided by RefSeq, Aug 2020] |
Target gene [STAT3] related to virus gene/protein/region 
Mutation Table: if previous studies reported that target gene was related to virus gene/region/protein, the information in this literature was listed in this section
Target gene [STAT3] related to VISs
Integration Table: if previous studies reported that target gene was altered by virus integration events, the overlap between VISs in this literature and Cistrome factors was listed in this section
| DVID |
Chromosome |
HM |
TFBS |
CA |
Sum of Overlapped Records |
Detail |
| 1002741 |
chr17 |
14 |
42 |
155 |
211 |
View |
Target gene [STAT3] related to Omics data
| Data ID |
Experiment type |
Sample number |
Platform |
|
GSE252863
|
scRNA-seq |
10 |
Illumina HiSeq 2500 (Homo sapiens) |
|
GSE236281
|
RNA-seq |
12 |
Illumina MiSeq (Homo sapiens) |
|
C GSE35465
|
Chip-seq;RNA-seq |
6 |
Illumina HiSeq 2000 (Homo sapiens) |
|
GSE199850
|
scRNA-seq |
1 |
HiSeq X Ten (Homo sapiens) |
|
C GSE68402
|
Chip-seq |
26 |
Illumina MiSeq (Homo sapiens);Illumina HiSeq 2500 (Homo sapiens) |
|
GSE247322
|
scRNA-seq |
27 |
Illumina NovaSeq 6000 (Homo sapiens) |
|
TCGA_LIHC_HBV
|
DNA methylation sequencing;RNA-seq |
97 |
TCGA |
|
C GSE270130
|
Chip-seq |
27 |
Illumina NovaSeq 6000 (Homo sapiens) |
|
C GSE64877
|
Chip-seq |
2 |
Illumina Genome Analyzer (Homo sapiens) |
|
GSE224901
|
RNA-seq |
21 |
Illumina NovaSeq 6000 (Homo sapiens) |
|
GSE100400
|
Chip-seq;RNA-seq;4C_cccDNA |
31 |
Illumina NextSeq 500 (Homo sapiens);Illumina NextSeq 500 (Mus musculus) |
|
GSE173897
|
RNA-seq |
95 |
Illumina HiSeq 4000 (Homo sapiens) |
|
GSE262515
|
RNA-seq |
21 |
Illumina HiSeq 2500 (Homo sapiens);Illumina HiSeq 2500 (Mus musculus) |
|
GSE110345
|
RNA-seq |
4 |
Illumina HiSeq 2500 (Homo sapiens) |
|
C GSE131257
|
ATAC-seq;RNA-seq |
19 |
Illumina HiSeq 2500 (Homo sapiens) |
|
GSE94660
|
RNA-seq |
42 |
Illumina HiSeq 2500 (Homo sapiens) |
When the gene can detect a peak in the dataset, a peak plot will be displayed.
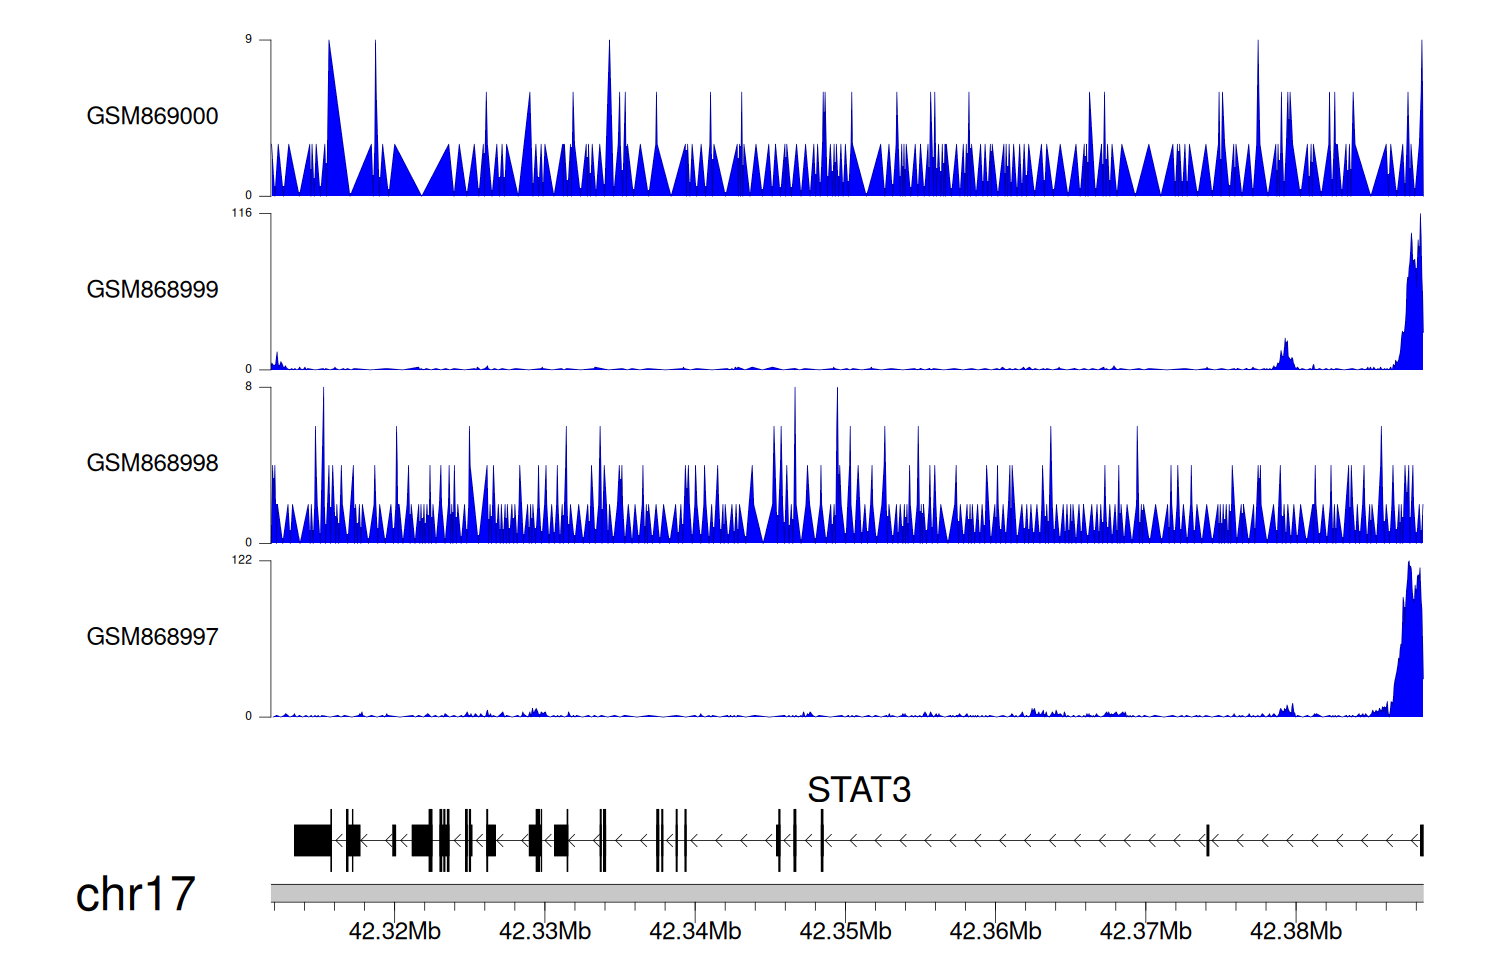
> Dataset: GSE35465 - STAT3 peak across samples
|
Peak Plot
|
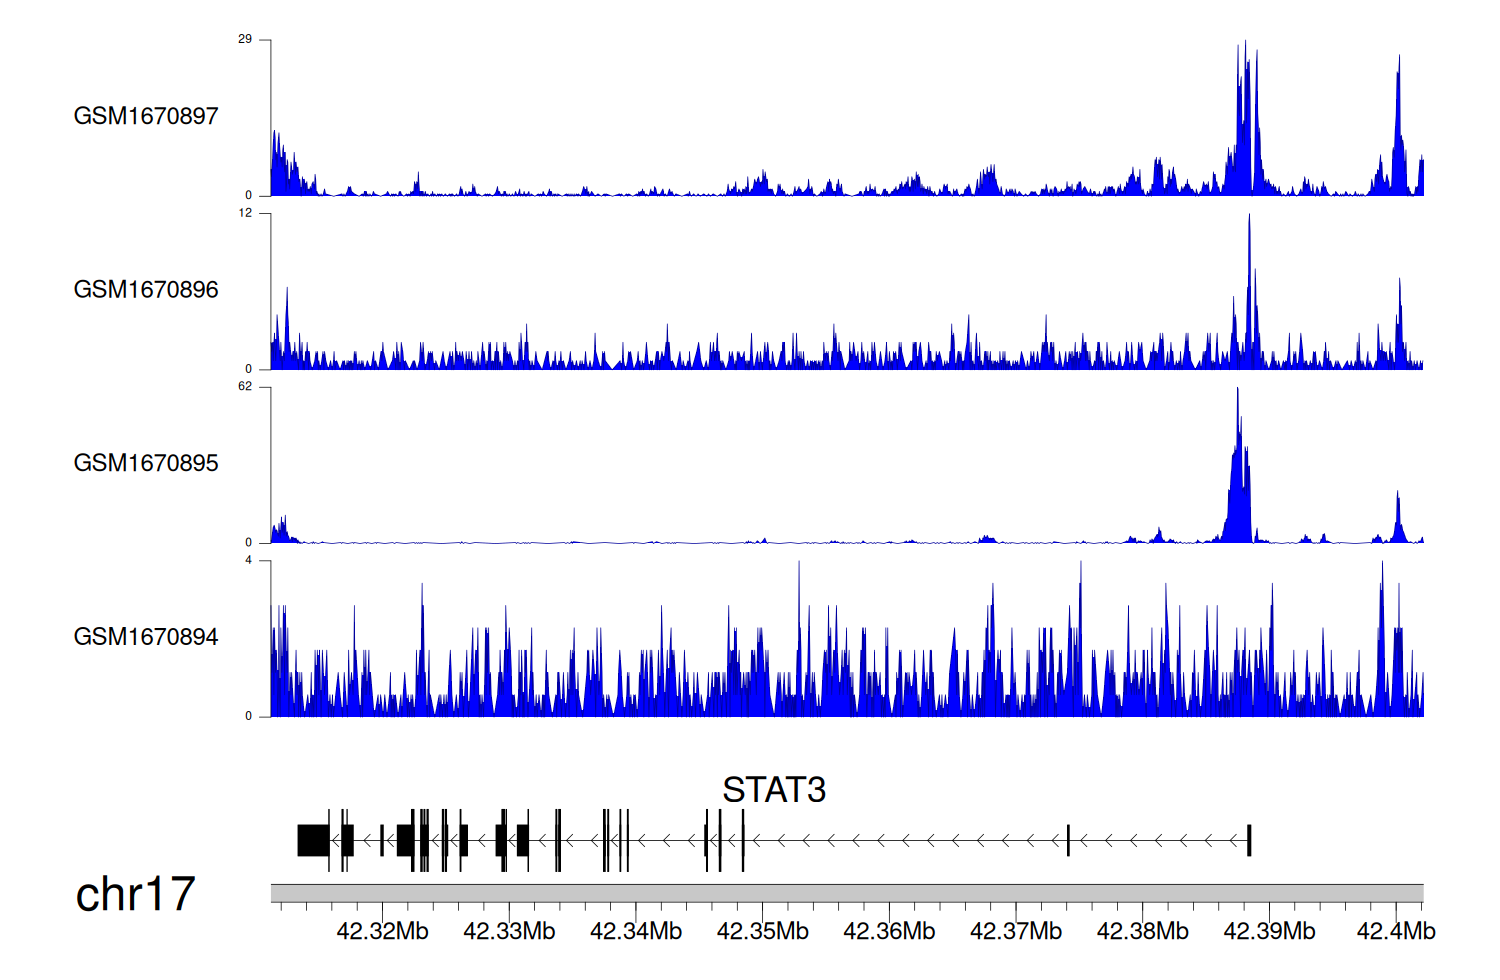
> Dataset: GSE68402 - STAT3 peak across samples
|
Peak Plot
|
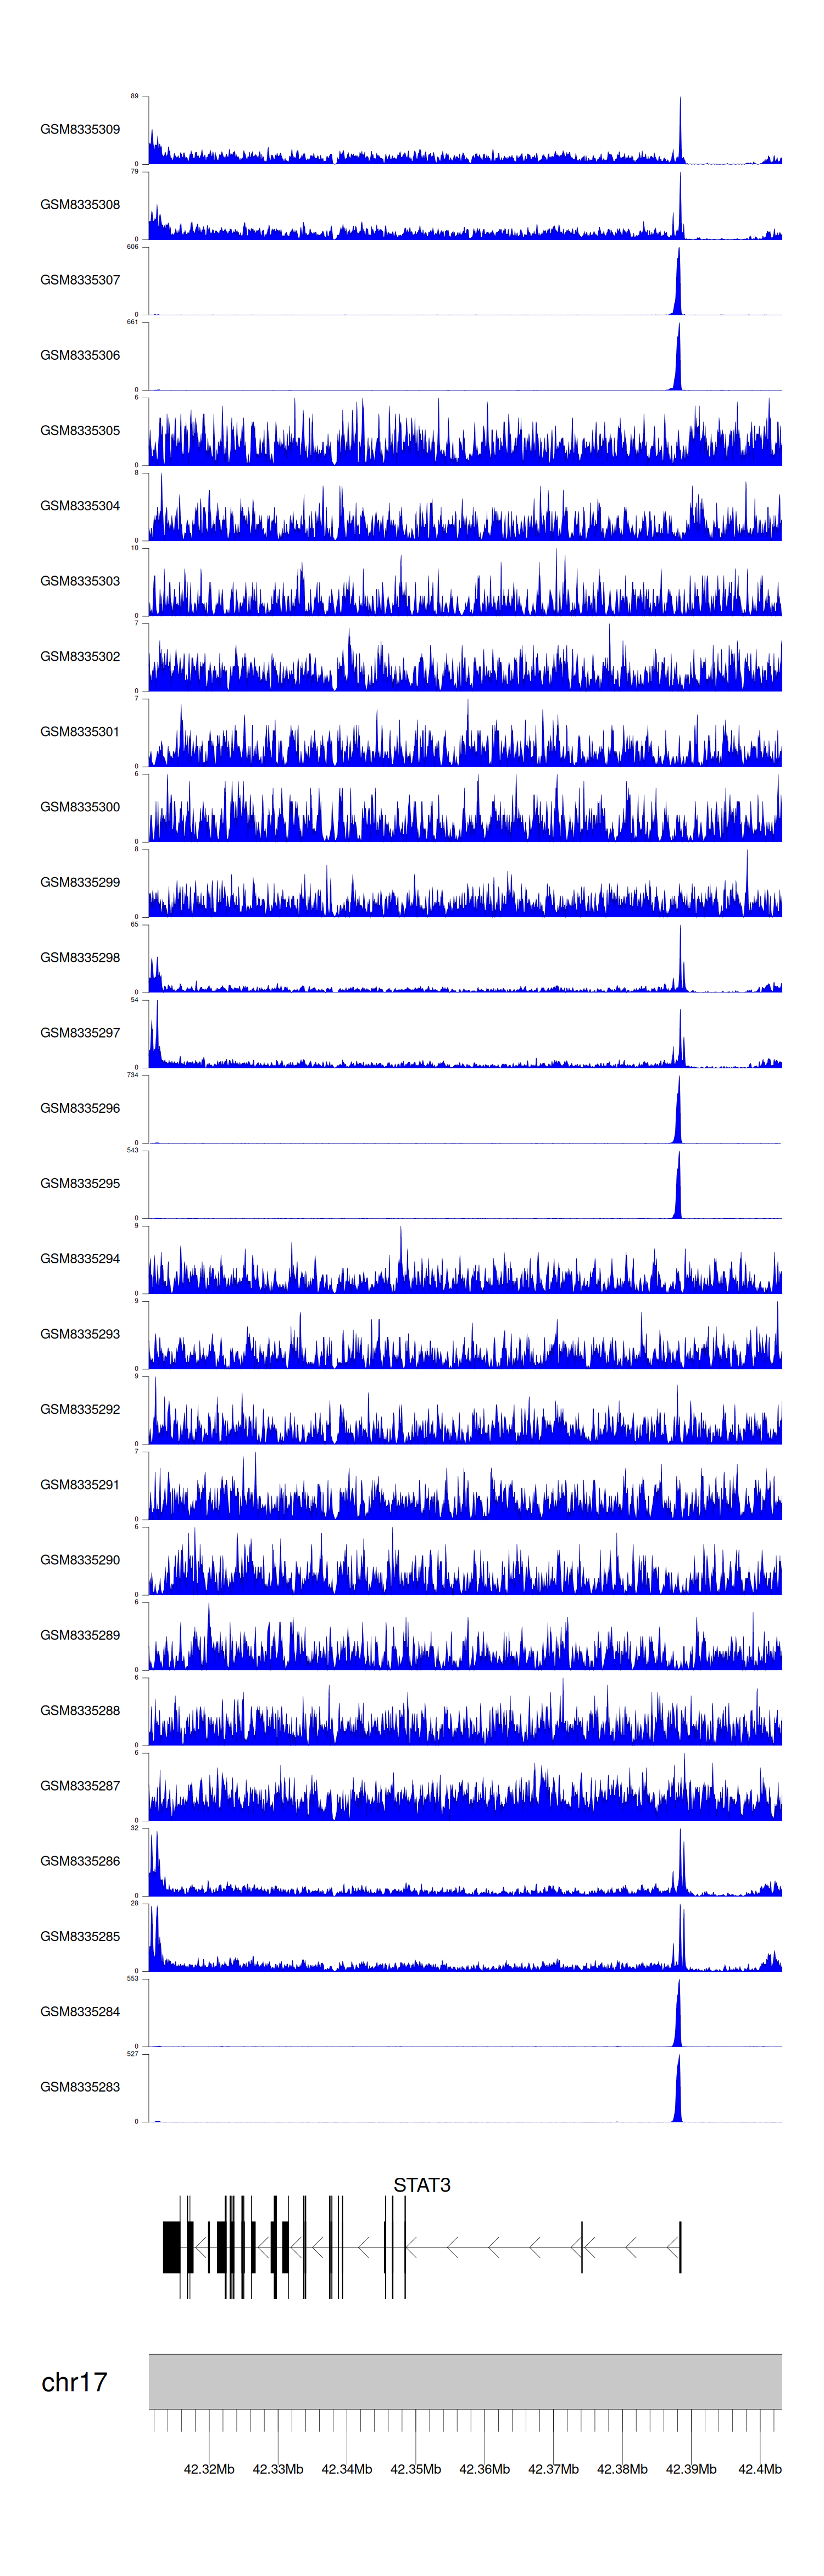
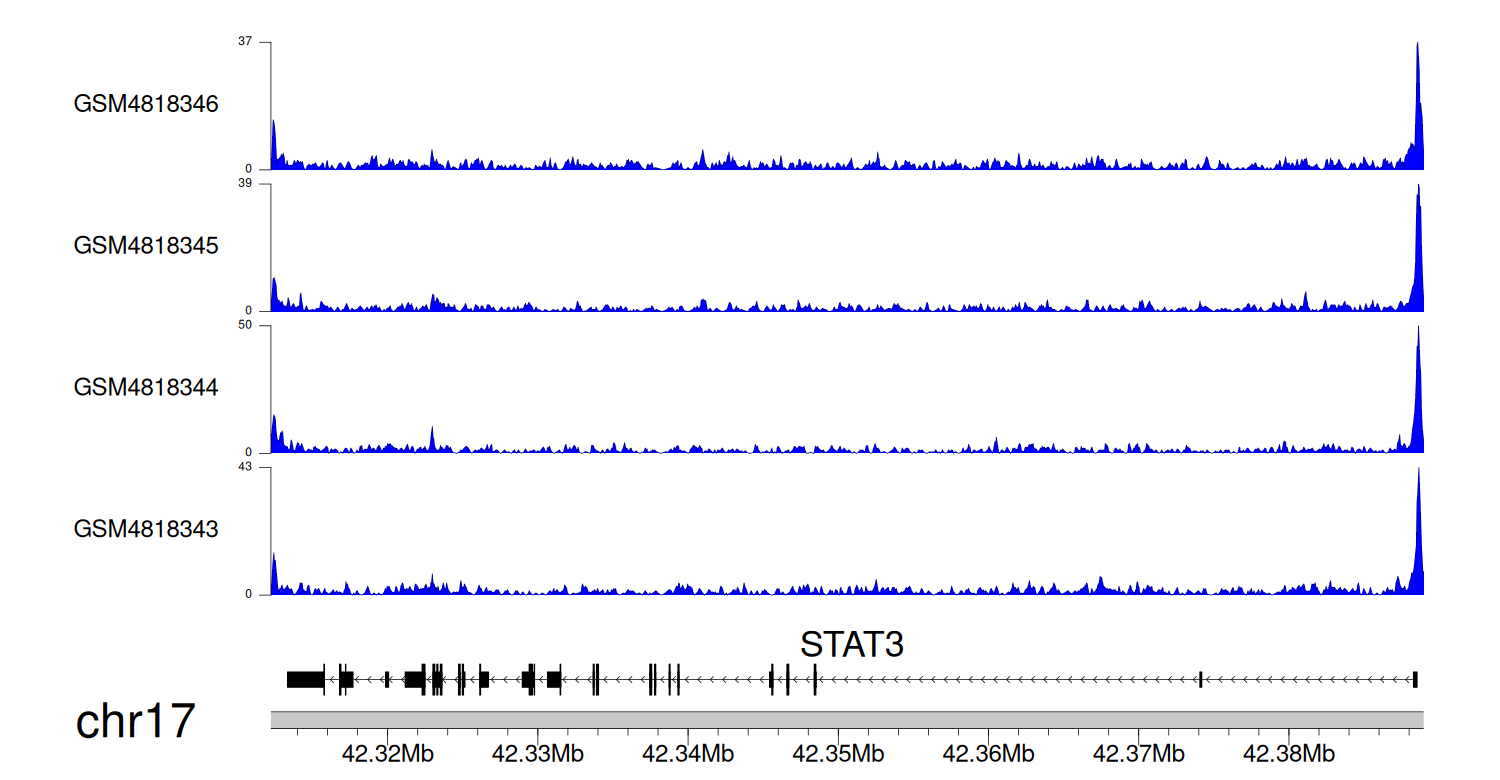
> Dataset: GSE270130 - STAT3 peak across samples
|
Peak Plot
|
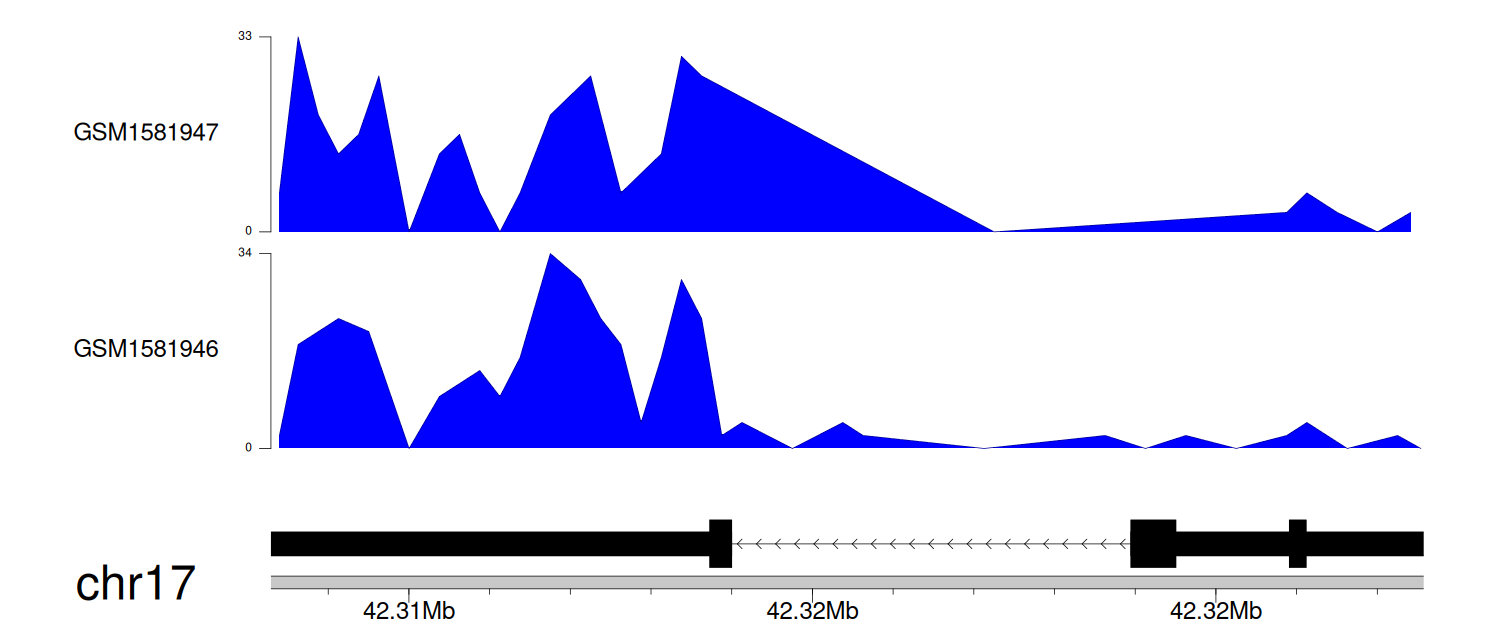
> Dataset: GSE64877 - STAT3 peak across samples
|
Peak Plot
|
> Dataset: GSE131257 - STAT3 peak across samples
|
Peak Plot
|
|
|
