Gene Information
|
Gene Name
|
CACNA1A |
|
Gene ID
|
773
|
|
Gene Full Name
|
calcium voltage-gated channel subunit alpha1 A |
|
Gene Alias
|
APCA|BI|CACNL1A4|CAV2.1|DEE42|EA2|EIEE42|FHM|HPCA|MHP|MHP1|SCA6 |
|
Transcripts
|
ENSG00000141837
|
|
Virus
|
HPV |
|
Gene Type
|
protein-coding |
|
HPA Location Info
|
Endoplasmic reticulum; 
|
|
Membrane Info
|
Disease related genes, FDA approved drug targets, Human disease related genes, Plasma proteins, Predicted intracellular proteins, Predicted membrane proteins, Transporters, Voltage-gated ion channels |
|
Uniport_ID
|
O00555
|
|
HGNC ID
|
HGNC:1388
|
|
OMIM ID
|
601011 |
|
Summary
|
Voltage-dependent calcium channels mediate the entry of calcium ions into excitable cells, and are also involved in a variety of calcium-dependent processes, including muscle contraction, hormone or neurotransmitter release, and gene expression. Calcium channels are multisubunit complexes composed of alpha-1, beta, alpha-2/delta, and gamma subunits. The channel activity is directed by the pore-forming alpha-1 subunit, whereas, the others act as auxiliary subunits regulating this activity. The distinctive properties of the calcium channel types are related primarily to the expression of a variety of alpha-1 isoforms, alpha-1A, B, C, D, E, and S. This gene encodes the alpha-1A subunit, which is predominantly expressed in neuronal tissue. Mutations in this gene are associated with 2 neurologic disorders, familial hemiplegic migraine and episodic ataxia 2. This gene also exhibits polymorphic variation due to (CAG)n-repeats. Multiple transcript variants encoding different isoforms have been found for this gene. In one set of transcript variants, the (CAG)n-repeats occur in the 3' UTR, and are not associated with any disease. But in another set of variants, an insertion extends the coding region to include the (CAG)n-repeats which encode a polyglutamine tract. Expansion of the (CAG)n-repeats from the normal 4-18 to 21-33 in the coding region is associated with spinocerebellar ataxia 6. [provided by RefSeq, Jul 2016] |
Target gene [CACNA1A] related to VISs 
Integration Table: if previous studies reported that target gene was altered by virus integration events, the overlap between VISs in this literature and Cistrome factors was listed in this section
| DVID |
Chromosome |
HM |
TFBS |
CA |
Sum of Overlapped Records |
Detail |
| 5005373 |
chr19 |
8 |
2 |
0 |
10 |
View |
| 5006517 |
chr19 |
12 |
0 |
0 |
12 |
View |
Target gene [CACNA1A] related to Omics data
| Data ID |
Experiment type |
Sample number |
Platform |
|
C GSE183048
|
Chip-seq |
24 |
Illumina HiSeq 4000 (Homo sapiens) |
|
GSE40774
|
Expression array |
134 |
Agilent-026652 Whole Human Genome Microarray 4x44K v2 (Probe Name version) |
|
GSE169622
|
Methylation profiling (Array) |
9 |
Infinium MethylationEPIC |
|
GSE65858
|
Expression array |
270 |
Illumina HumanHT-12 V4.0 expression beadchip |
|
GSE181805
|
Expression array |
25 |
[HTA-2_0] Affymetrix Human Transcriptome Array 2.0 [transcript (gene) version] |
|
GSE196215
|
RNA-seq |
8 |
Illumina NovaSeq 6000 (Homo sapiens) |
|
GSE138080
|
Expression array |
35 |
Agilent-014850 Whole Human Genome Microarray 4x44K G4112F (Feature Number version) |
|
GSE140662
|
Expression array |
8 |
[HTA-2_0] Affymetrix Human Transcriptome Array 2.0 [transcript (gene) version] |
|
GSE55542
|
Expression array |
36 |
Agilent-039494 SurePrint G3 Human GE v2 8x60K Microarray 039381 (Probe Name version) |
|
C GSE143026
|
ATAC-seq;Chip-seq;RNA-seq |
30 |
Illumina HiSeq 2500 (Homo sapiens) |
|
M TCGA_CESC
|
DNA methylation sequencing;RNA-seq |
288 |
TCGA |
|
GSE51993
|
Expression array |
48 |
Illumina Human v2 MicroRNA expression beadchip;Illumina HumanHT-12 V4.0 expression beadchip |
|
GSE55550
|
Expression array |
155 |
Agilent-039494 SurePrint G3 Human GE v2 8x60K Microarray 039381 (Probe Name version) |
|
GSE165883
|
RNA-seq |
20 |
Illumina NextSeq 500 (Homo sapiens) |
When the query gene is differentially changed in the dataset, a volcano/bar plot will be displayed.
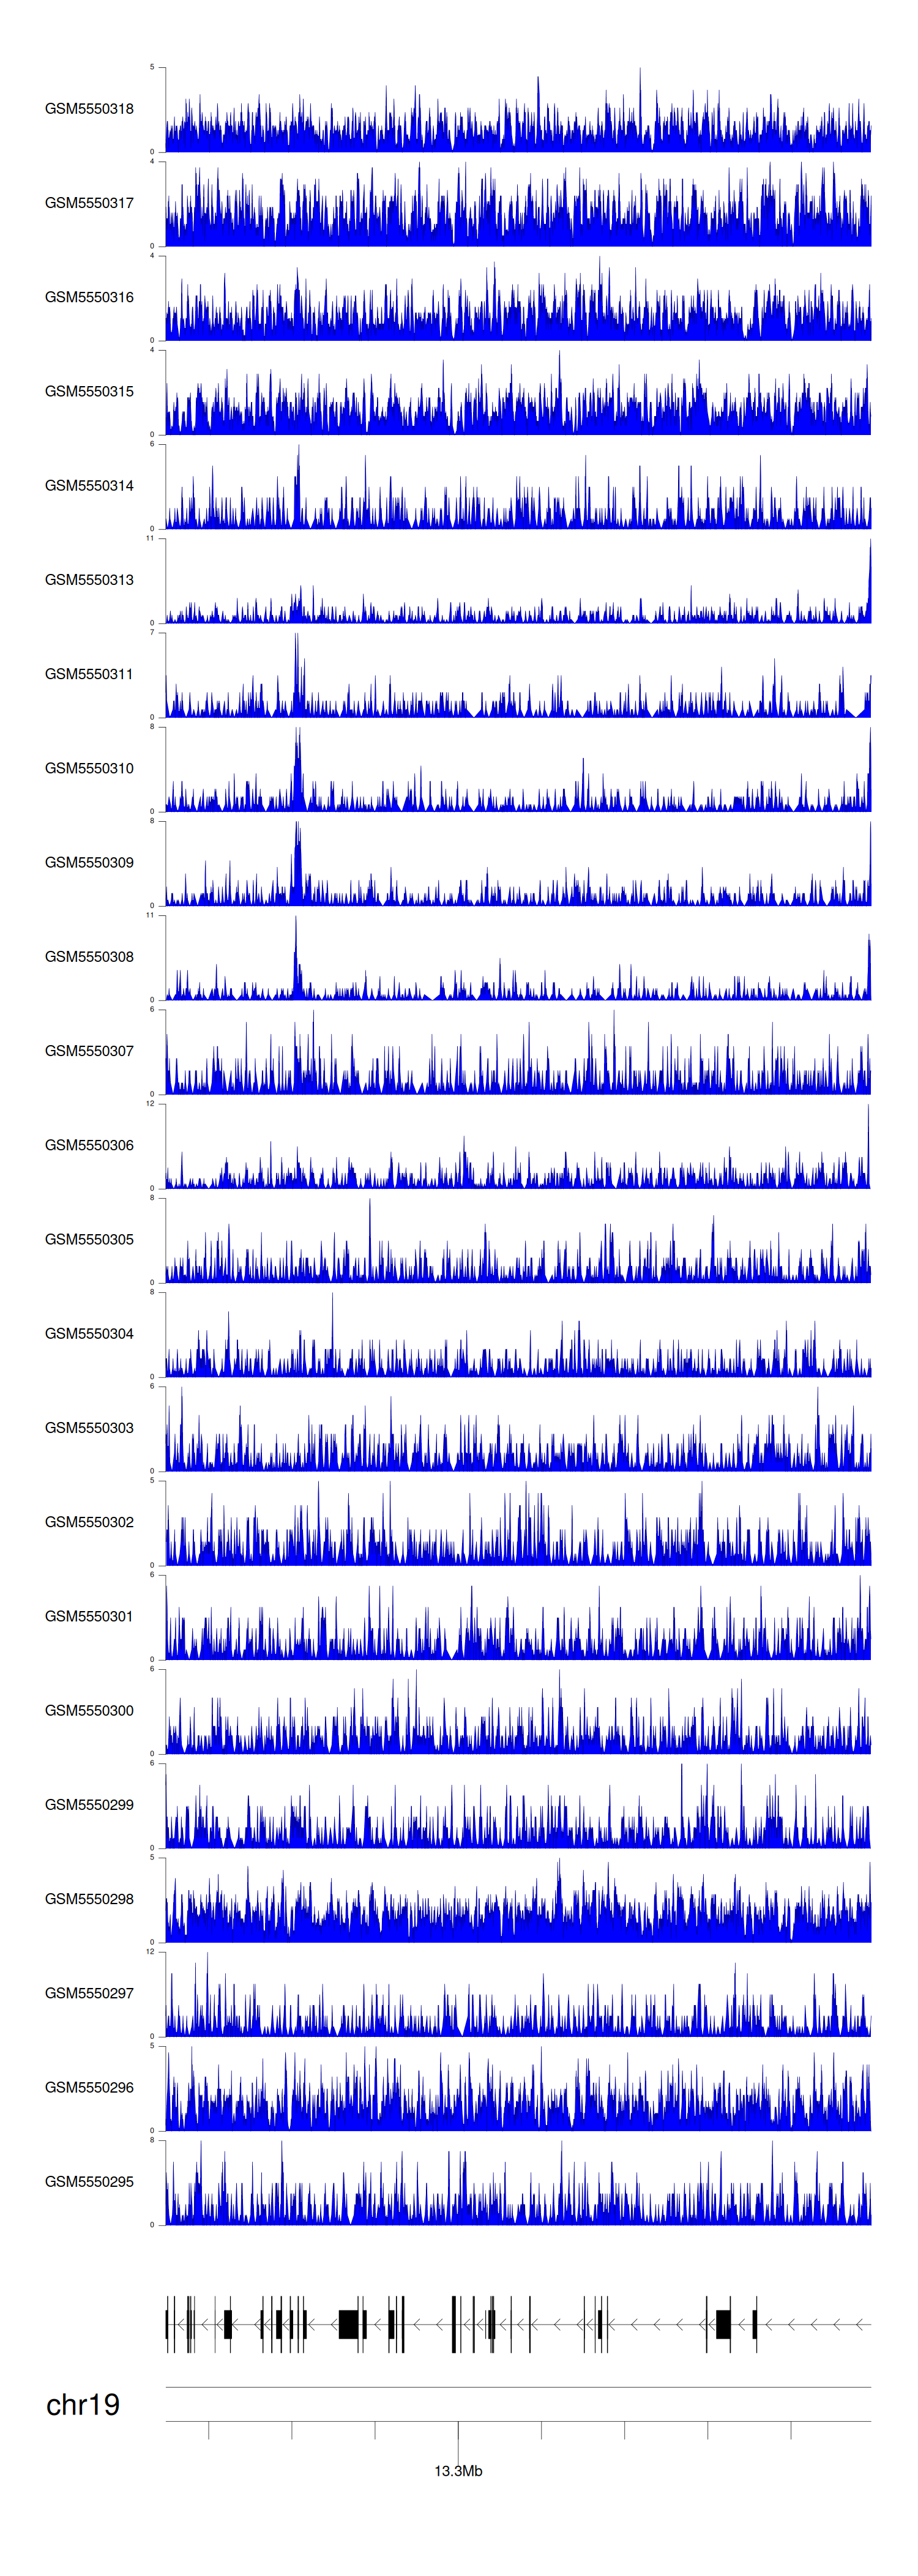
> Dataset: GSE183048 - CACNA1A peak across samples
|
Peak Plot
|
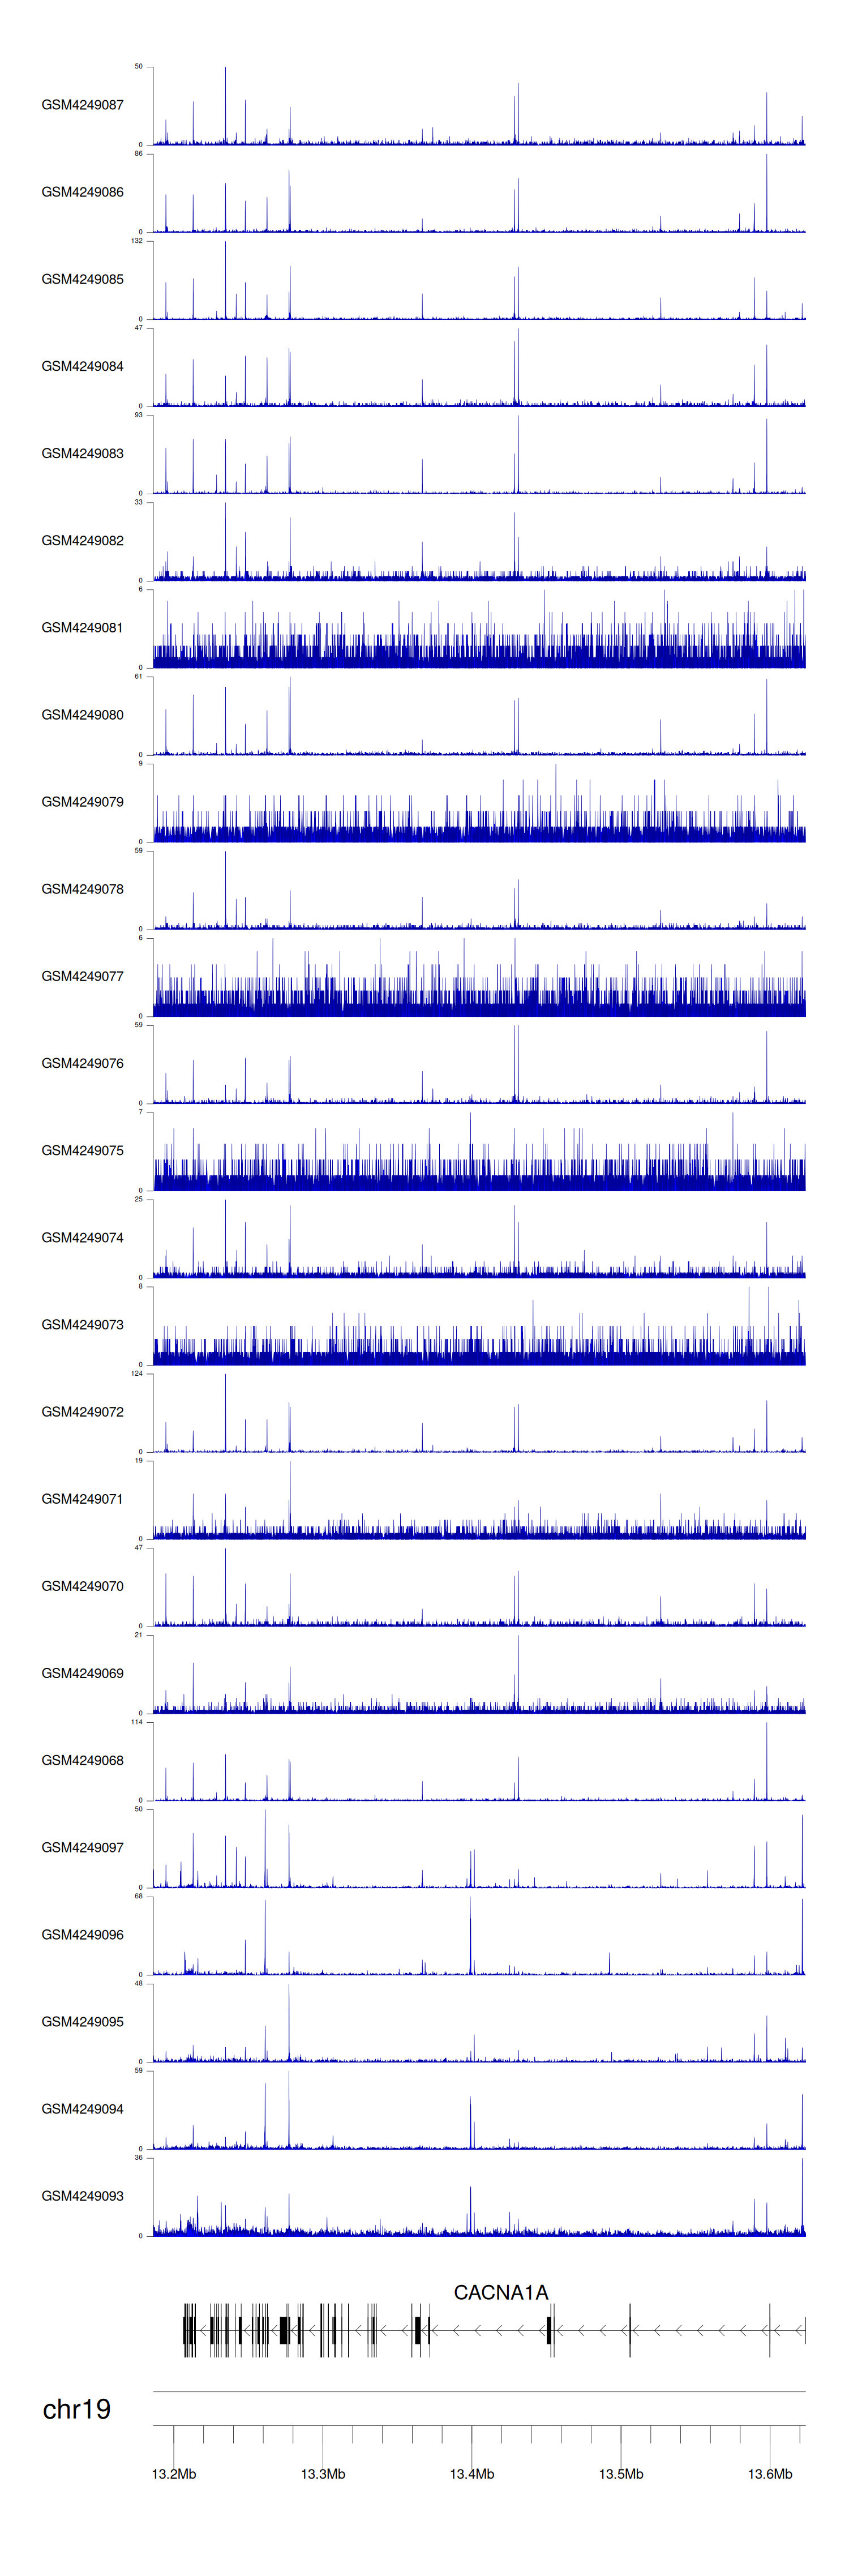
> Dataset: GSE143026 - CACNA1A peak across samples
|
Peak Plot
|
|
|
