|
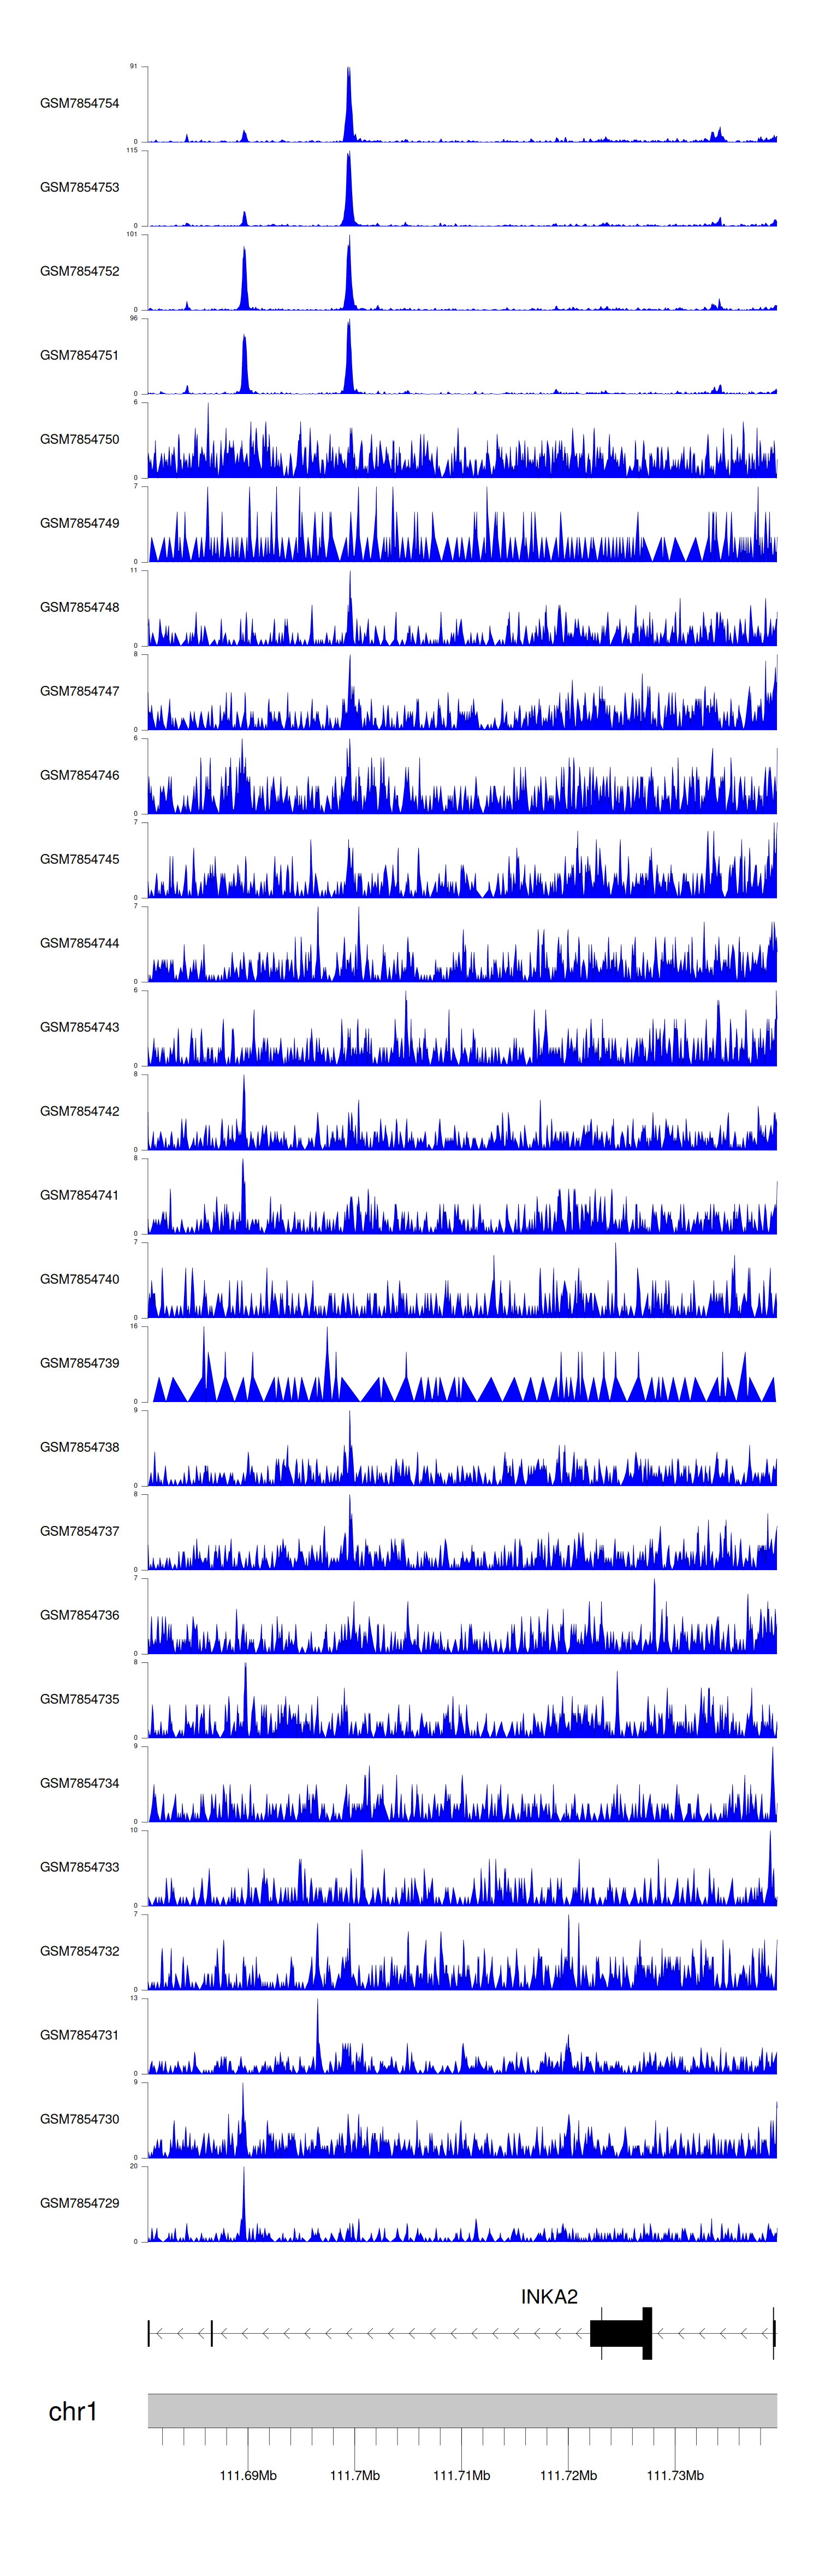
C GSE246060
|
Chip-seq |
26 |
Illumina NovaSeq 6000 (Homo sapiens) |
|
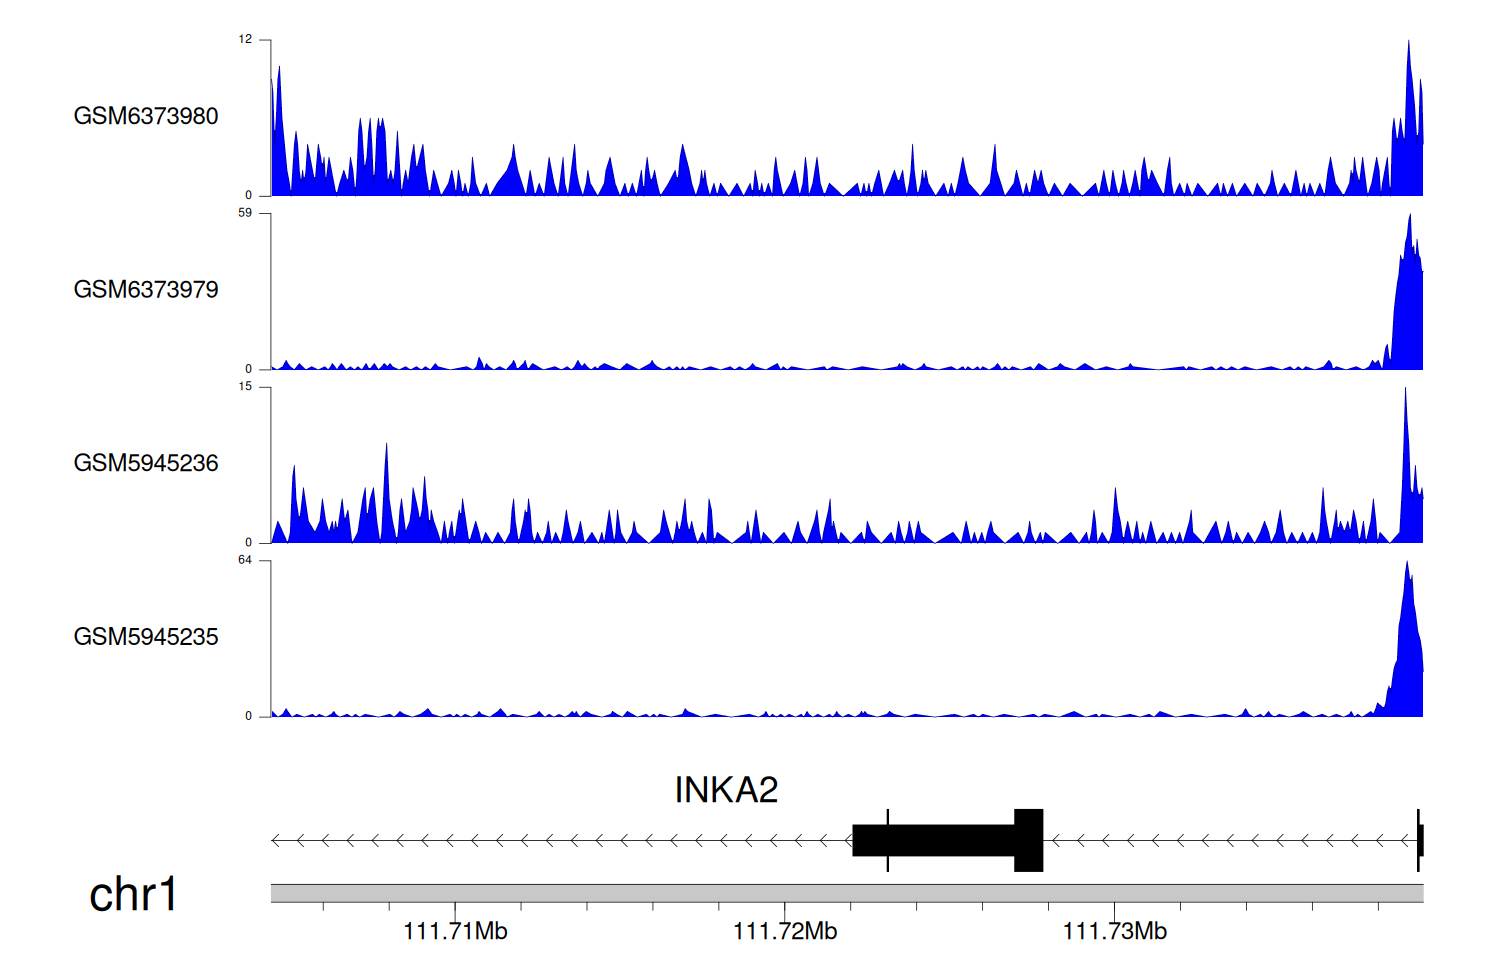
C GSE198334
|
Chip-seq |
4 |
Illumina NextSeq 500 (Homo sapiens) |
|
GSE100458
|
Expression array |
14 |
[HG-U133_Plus_2] Affymetrix Human Genome U133 Plus 2.0 Array [CDF: Brainarray HGU133Plus2_Hs_ENTREZG_v21] |
|
GSE165194
|
RNA-seq |
3 |
Illumina NextSeq 500 (Homo sapiens) |
|
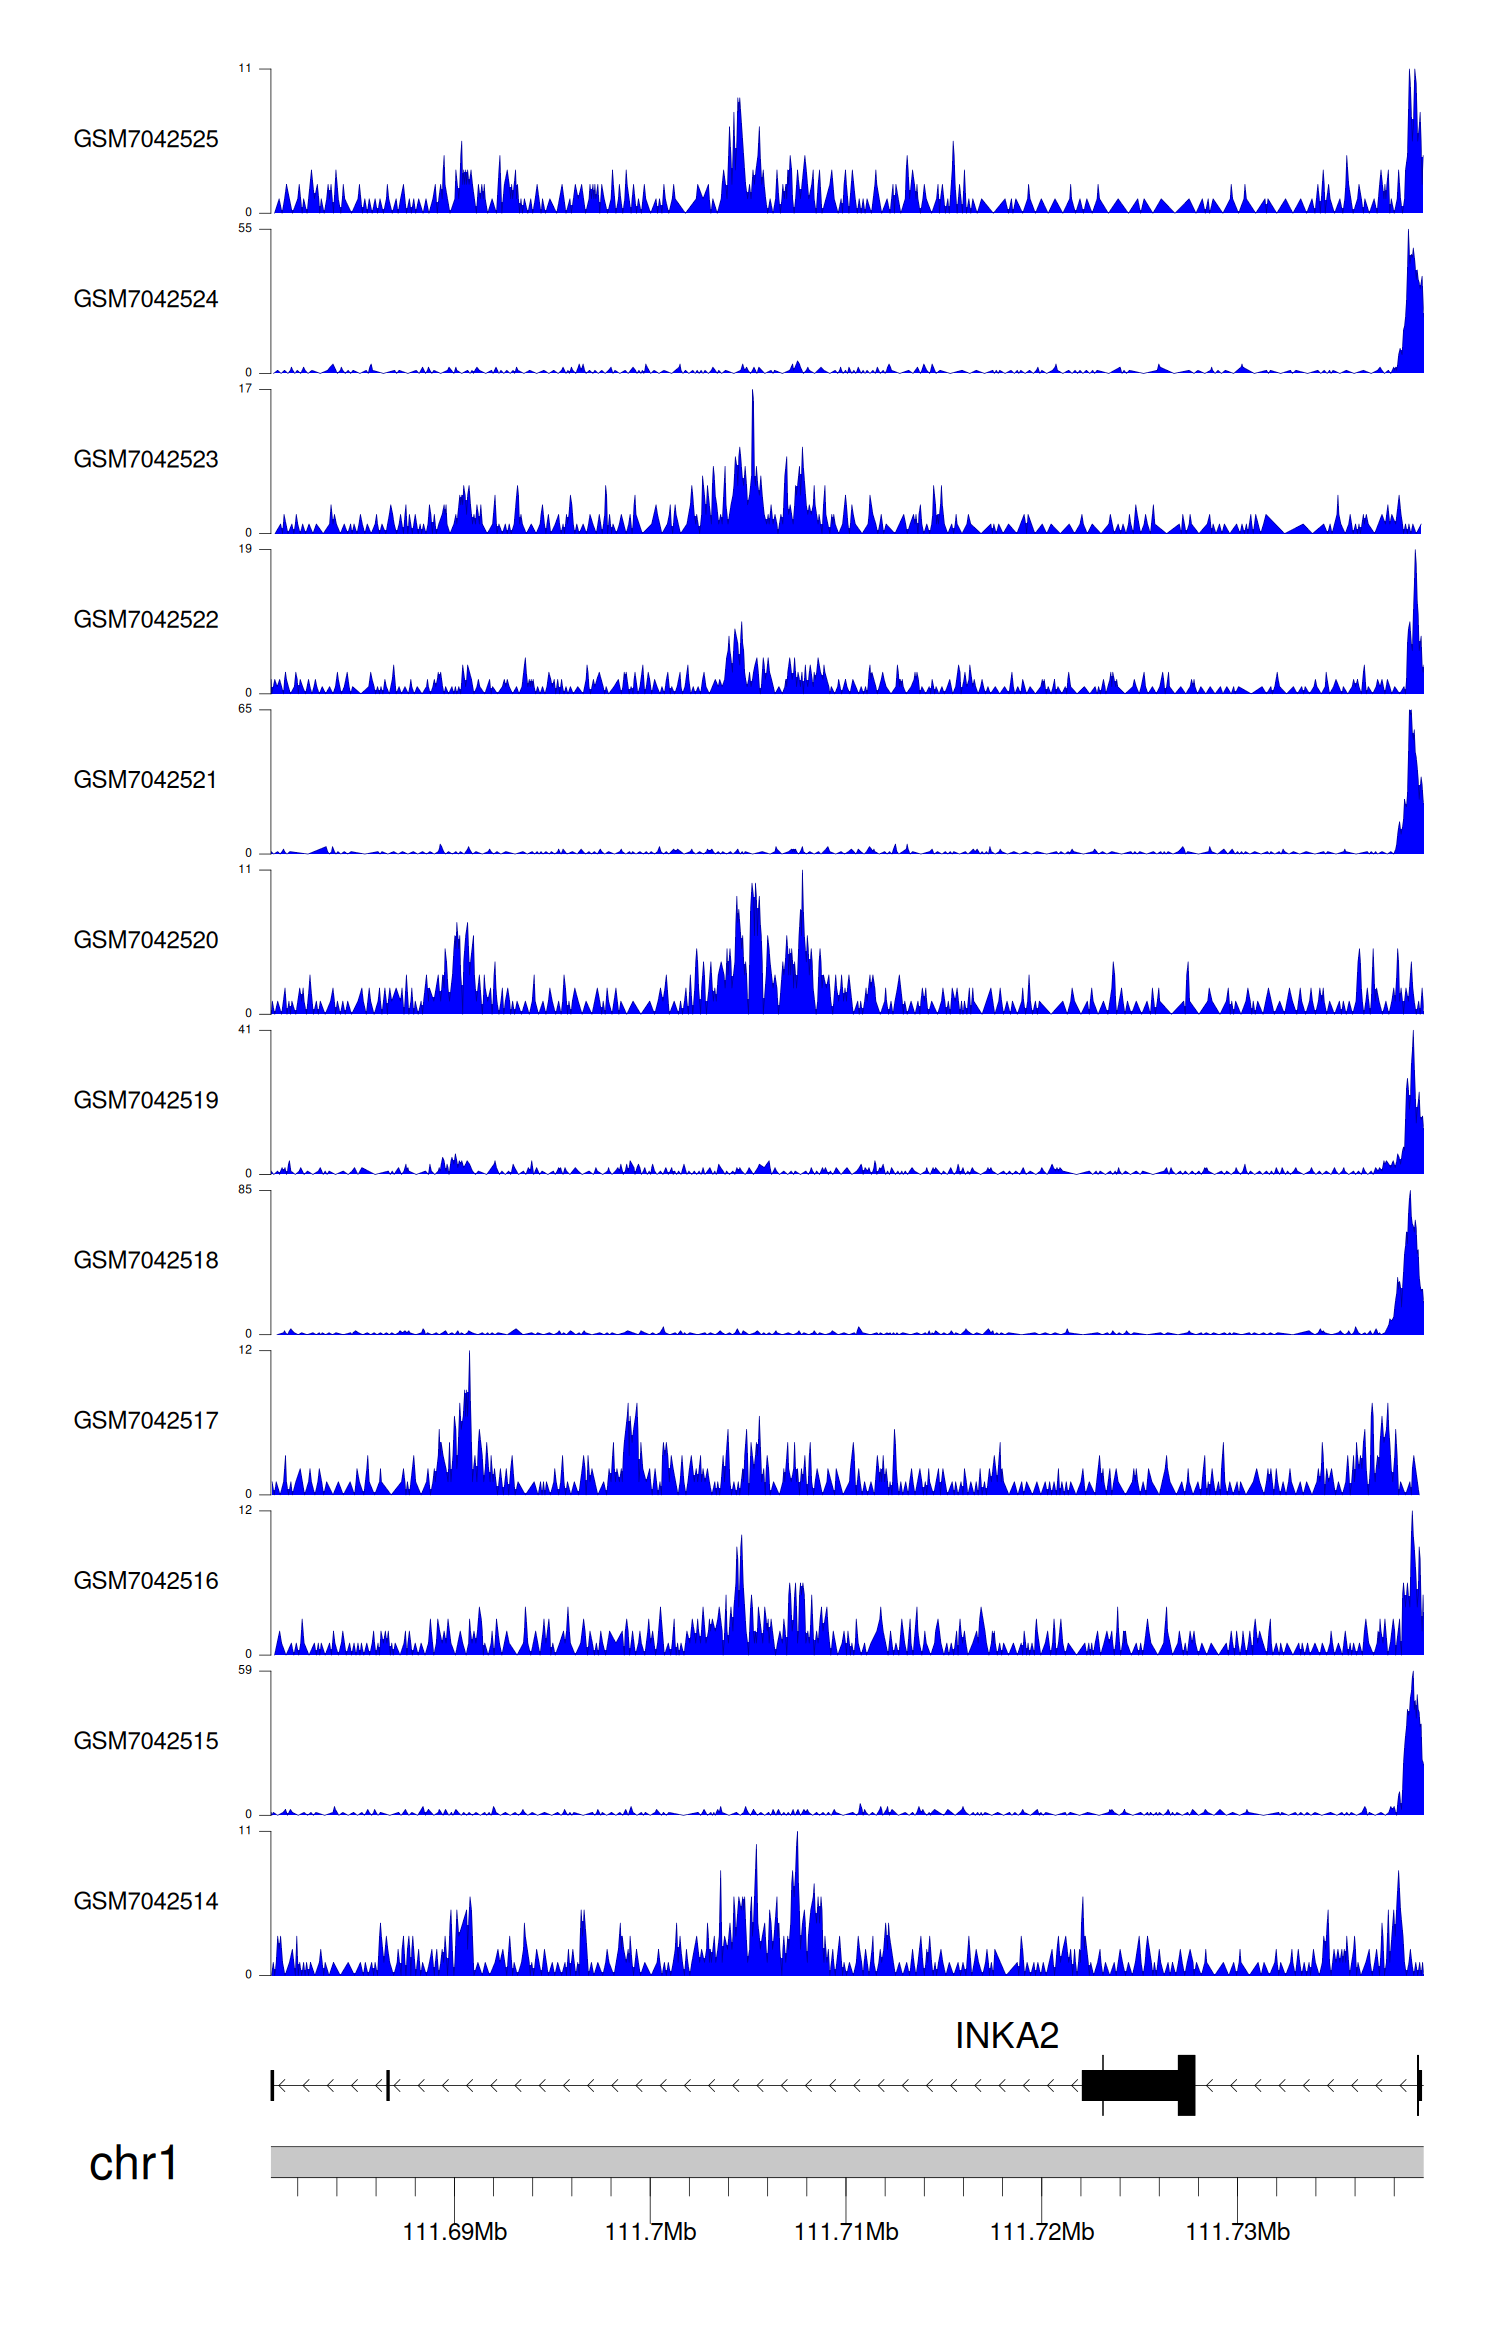
C GSE246059
|
ATAC-seq |
8 |
Illumina NextSeq 500 (Homo sapiens);Illumina NovaSeq 6000 (Homo sapiens) |
|
GSE177046
|
RNA-seq |
6 |
Illumina HiSeq 2000 (Homo sapiens) |
|
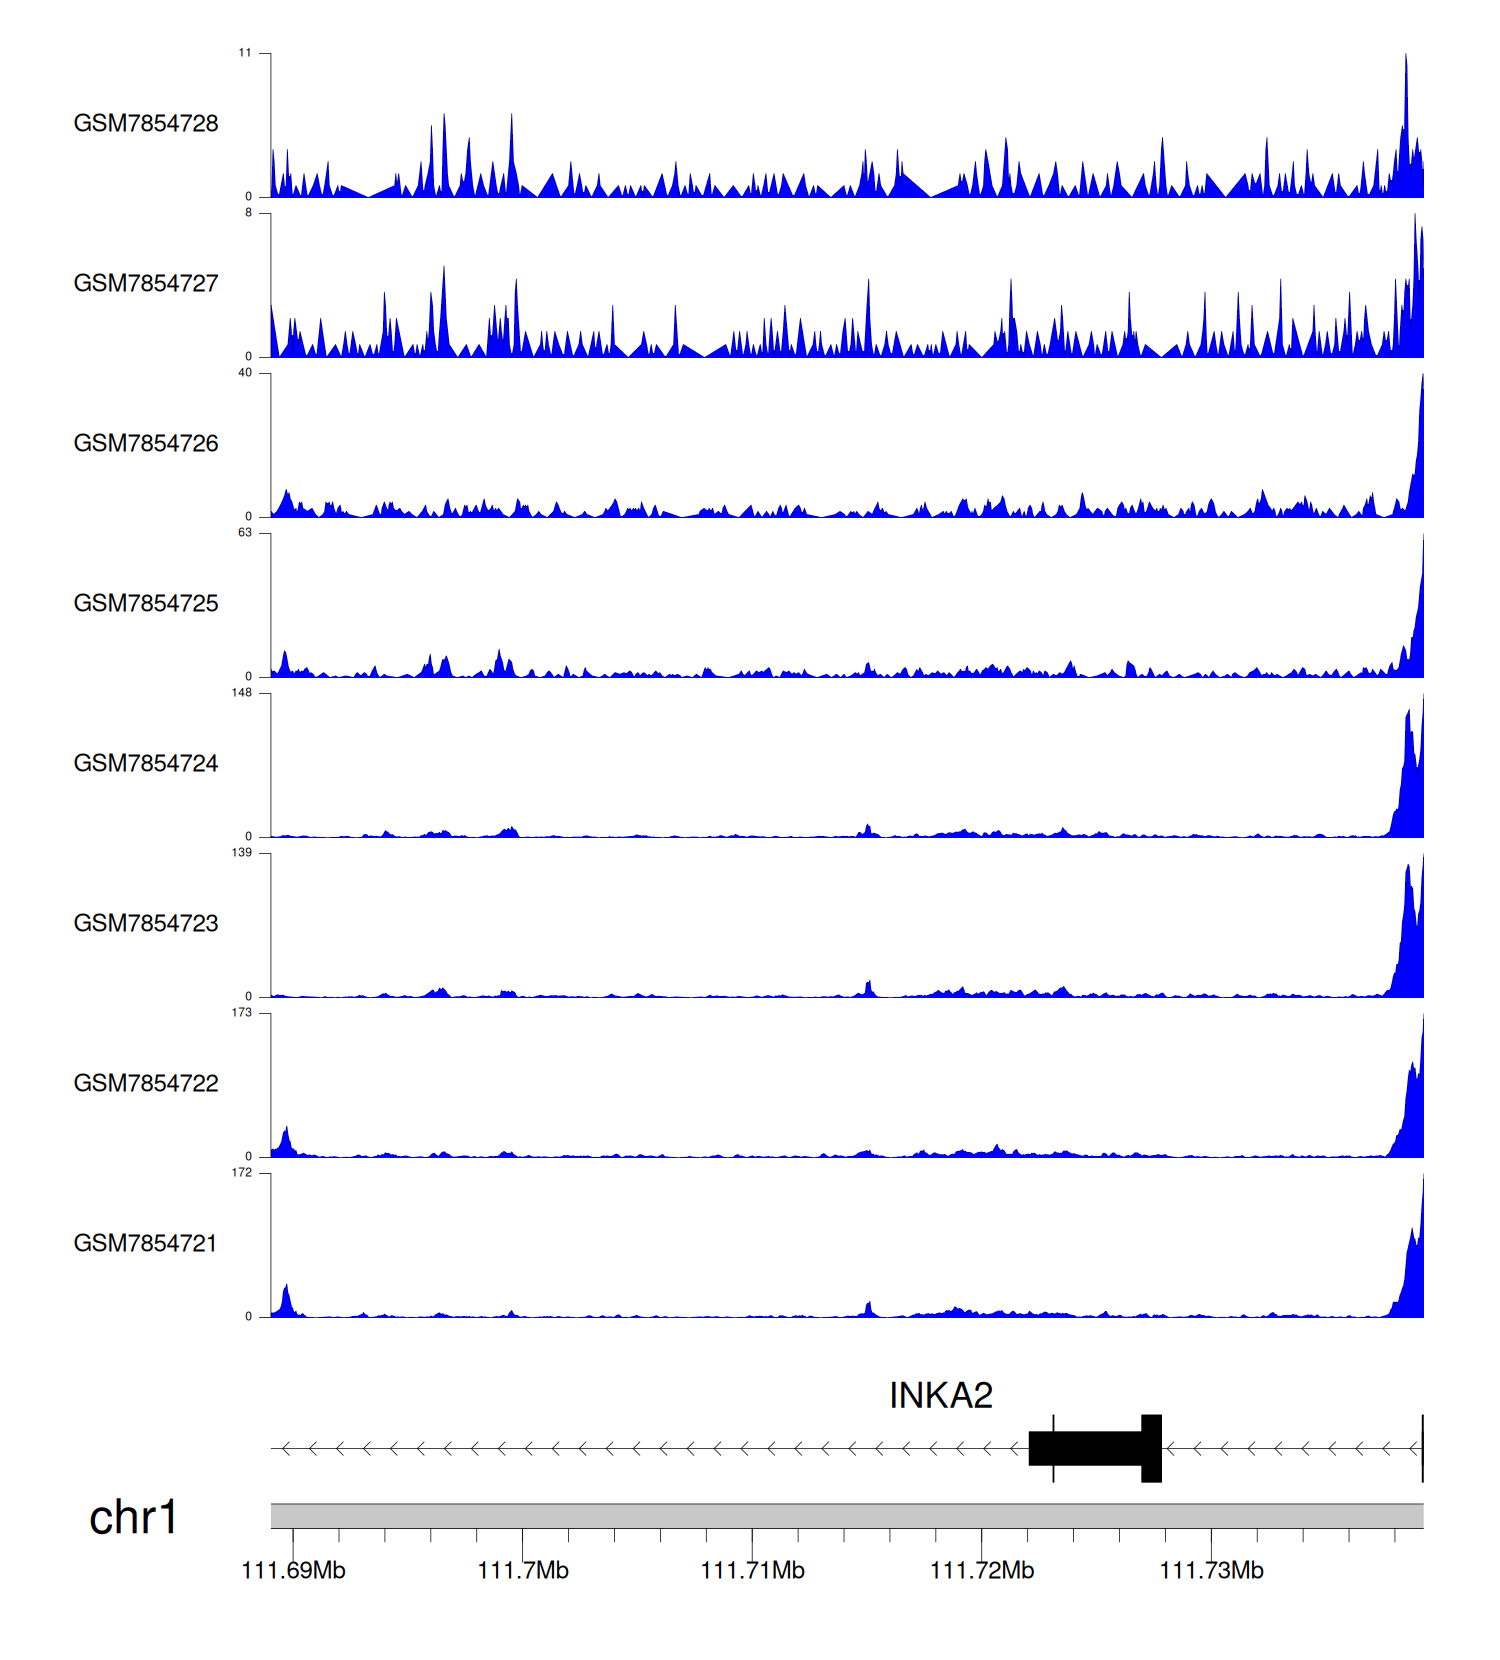
C GSE225248
|
Chip-seq |
12 |
Illumina NextSeq 500 (Homo sapiens) |
|
GSE102203
|
Expression array |
10 |
[HuGene-2_0-st] Affymetrix Human Gene 2.0 ST Array [probe set (exon) version] |
|
GSE85599
|
Expression array |
17 |
[HTA-2_0] Affymetrix Human Transcriptome Array 2.0 [transcript (gene) version] |
|
GSE181906
|
RNA-seq |
24 |
Illumina NovaSeq 6000 (Homo sapiens) |