Gene Information
|
Gene Name
|
SMAD2 |
|
Gene ID
|
4087
|
|
Gene Full Name
|
SMAD family member 2 |
|
Gene Alias
|
CHTD8|JV18|JV18-1|LDS6|MADH2|MADR2|hMAD-2|hSMAD2 |
|
Transcripts
|
ENSG00000175387
|
|
Virus
|
HPV |
|
Gene Type
|
protein-coding |
|
HPA Location Info
|
Nucleoplasm, Nucleoli;Vesicles, Primary cilium transition zone, Cytosol; 
|
|
Membrane Info
|
Cancer-related genes, Disease related genes, Human disease related genes, Plasma proteins, Predicted intracellular proteins, Predicted membrane proteins, Transcription factors |
|
Uniport_ID
|
Q15796
|
|
HGNC ID
|
HGNC:6768
|
|
OMIM ID
|
601366 |
|
Summary
|
The protein encoded by this gene belongs to the SMAD, a family of proteins similar to the gene products of the Drosophila gene 'mothers against decapentaplegic' (Mad) and the C. elegans gene Sma. SMAD proteins are signal transducers and transcriptional modulators that mediate multiple signaling pathways. This protein mediates the signal of the transforming growth factor (TGF)-beta, and thus regulates multiple cellular processes, such as cell proliferation, apoptosis, and differentiation. This protein is recruited to the TGF-beta receptors through its interaction with the SMAD anchor for receptor activation (SARA) protein. In response to TGF-beta signal, this protein is phosphorylated by the TGF-beta receptors. The phosphorylation induces the dissociation of this protein with SARA and the association with the family member SMAD4. The association with SMAD4 is important for the translocation of this protein into the nucleus, where it binds to target promoters and forms a transcription repressor complex with other cofactors. This protein can also be phosphorylated by activin type 1 receptor kinase, and mediates the signal from the activin. Alternatively spliced transcript variants have been observed for this gene. [provided by RefSeq, May 2012] |
Target gene [SMAD2] related to VISs 
Integration Table: if previous studies reported that target gene was altered by virus integration events, the overlap between VISs in this literature and Cistrome factors was listed in this section
| DVID |
Chromosome |
HM |
TFBS |
CA |
Sum of Overlapped Records |
Detail |
| 5004718 |
chr18 |
926 |
907 |
552 |
2385 |
View |
| 5015308 |
chr18 |
98 |
5 |
0 |
103 |
View |
Target gene [SMAD2] related to Omics data
| Data ID |
Experiment type |
Sample number |
Platform |
|
C GSE183048
|
Chip-seq |
24 |
Illumina HiSeq 4000 (Homo sapiens) |
|
GSE226620
|
scRNA-seq |
30 |
HiSeq X Ten (Homo sapiens) |
|
GSE40774
|
Expression array |
134 |
Agilent-026652 Whole Human Genome Microarray 4x44K v2 (Probe Name version) |
|
GSE169622
|
Methylation profiling (Array) |
9 |
Infinium MethylationEPIC |
|
GSE65858
|
Expression array |
270 |
Illumina HumanHT-12 V4.0 expression beadchip |
|
GSE181805
|
Expression array |
25 |
[HTA-2_0] Affymetrix Human Transcriptome Array 2.0 [transcript (gene) version] |
|
GSE196215
|
RNA-seq |
8 |
Illumina NovaSeq 6000 (Homo sapiens) |
|
GSE164690
|
scRNA-seq |
51 |
Illumina NextSeq 500 (Homo sapiens) |
|
GSE138080
|
Expression array |
35 |
Agilent-014850 Whole Human Genome Microarray 4x44K G4112F (Feature Number version) |
|
GSE140662
|
Expression array |
8 |
[HTA-2_0] Affymetrix Human Transcriptome Array 2.0 [transcript (gene) version] |
|
GSE55542
|
Expression array |
36 |
Agilent-039494 SurePrint G3 Human GE v2 8x60K Microarray 039381 (Probe Name version) |
|
C GSE143026
|
ATAC-seq;Chip-seq;RNA-seq |
30 |
Illumina HiSeq 2500 (Homo sapiens) |
|
TCGA_CESC
|
DNA methylation sequencing;RNA-seq |
288 |
TCGA |
|
GSE51993
|
Expression array |
48 |
Illumina Human v2 MicroRNA expression beadchip;Illumina HumanHT-12 V4.0 expression beadchip |
|
GSE197461
|
scRNA-seq |
16 |
Illumina NovaSeq 6000 (Homo sapiens) |
|
GSE55550
|
Expression array |
155 |
Agilent-039494 SurePrint G3 Human GE v2 8x60K Microarray 039381 (Probe Name version) |
|
GSE165883
|
RNA-seq |
20 |
Illumina NextSeq 500 (Homo sapiens) |
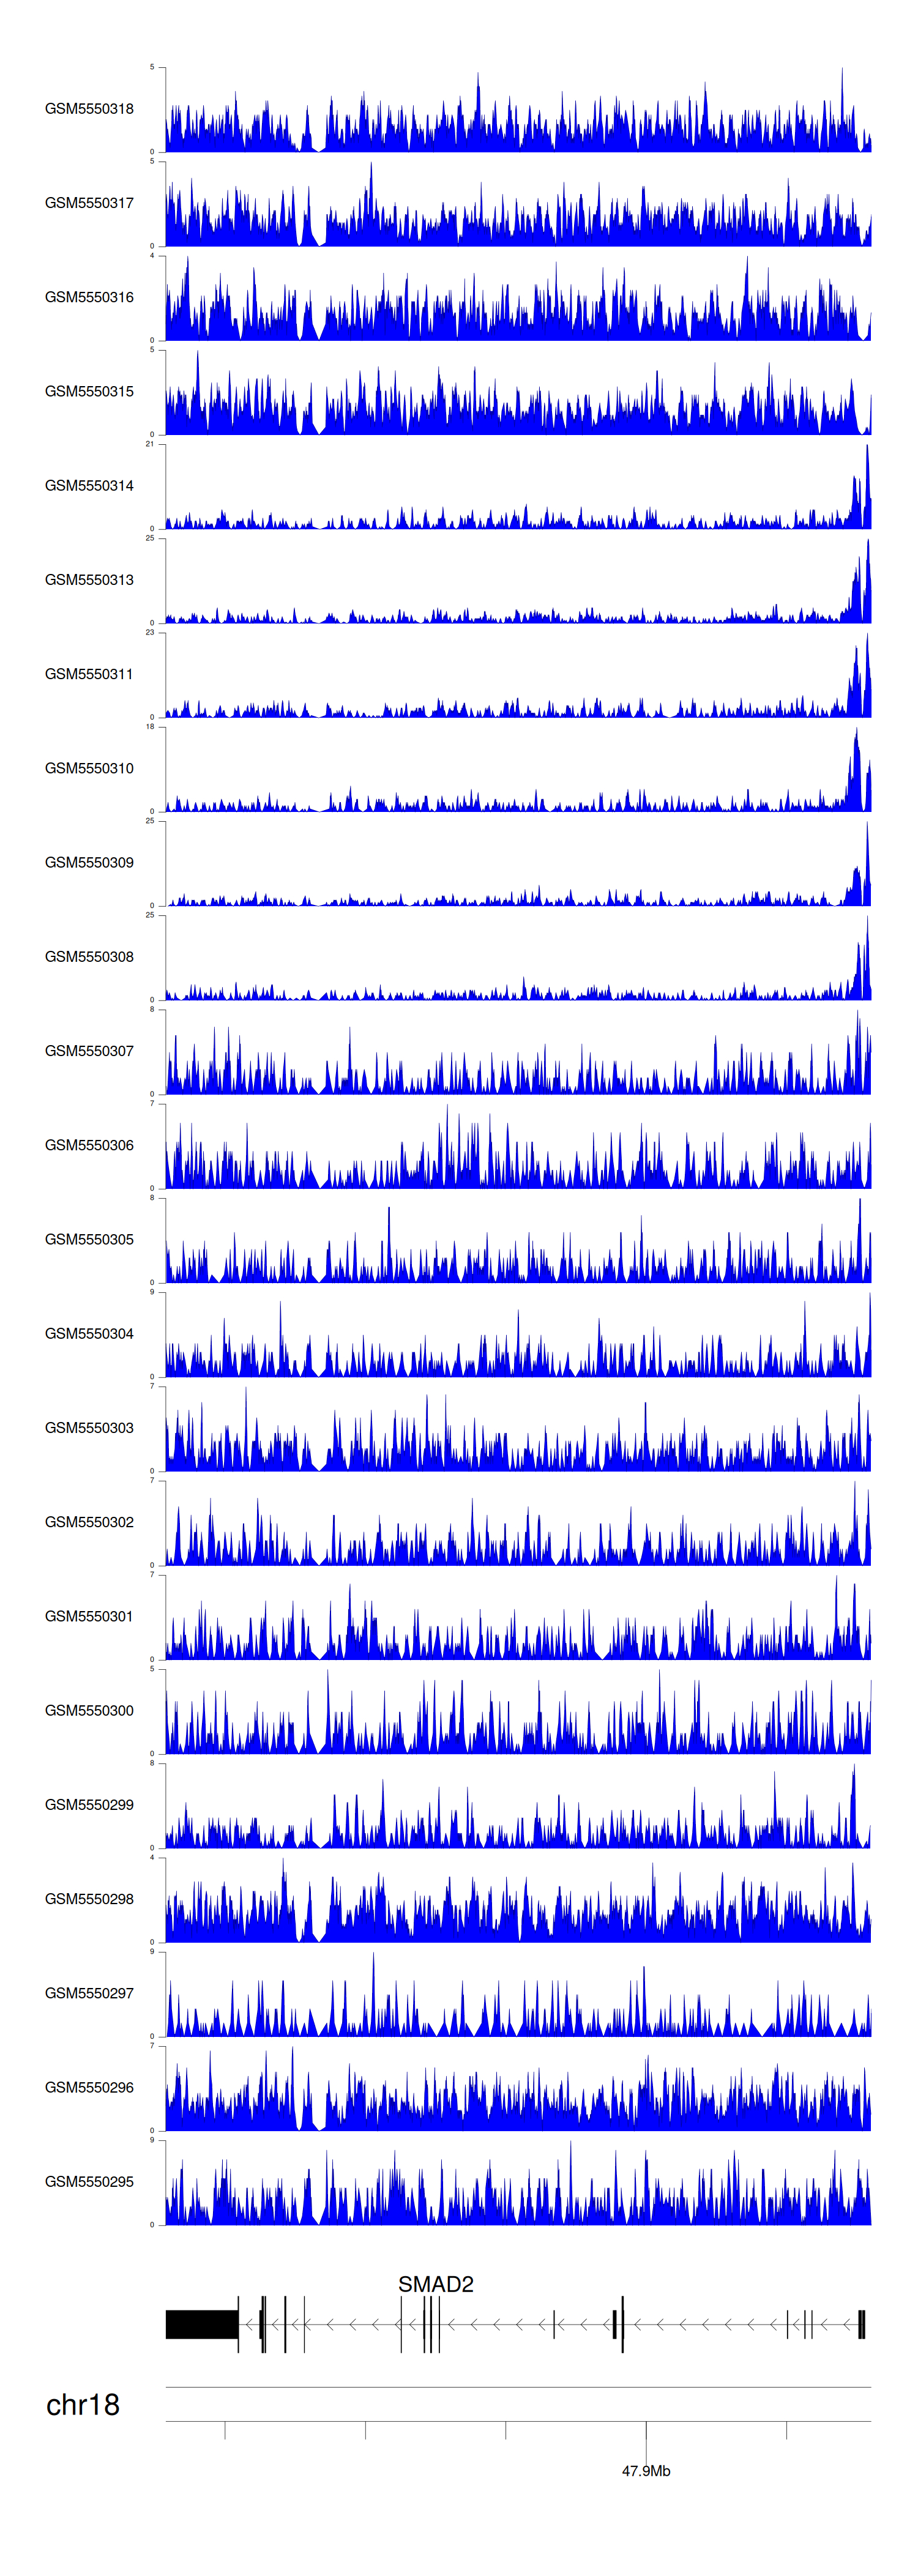
When the gene can detect a peak in the dataset, a peak plot will be displayed.
> Dataset: GSE183048 - SMAD2 peak across samples
|
Peak Plot
|
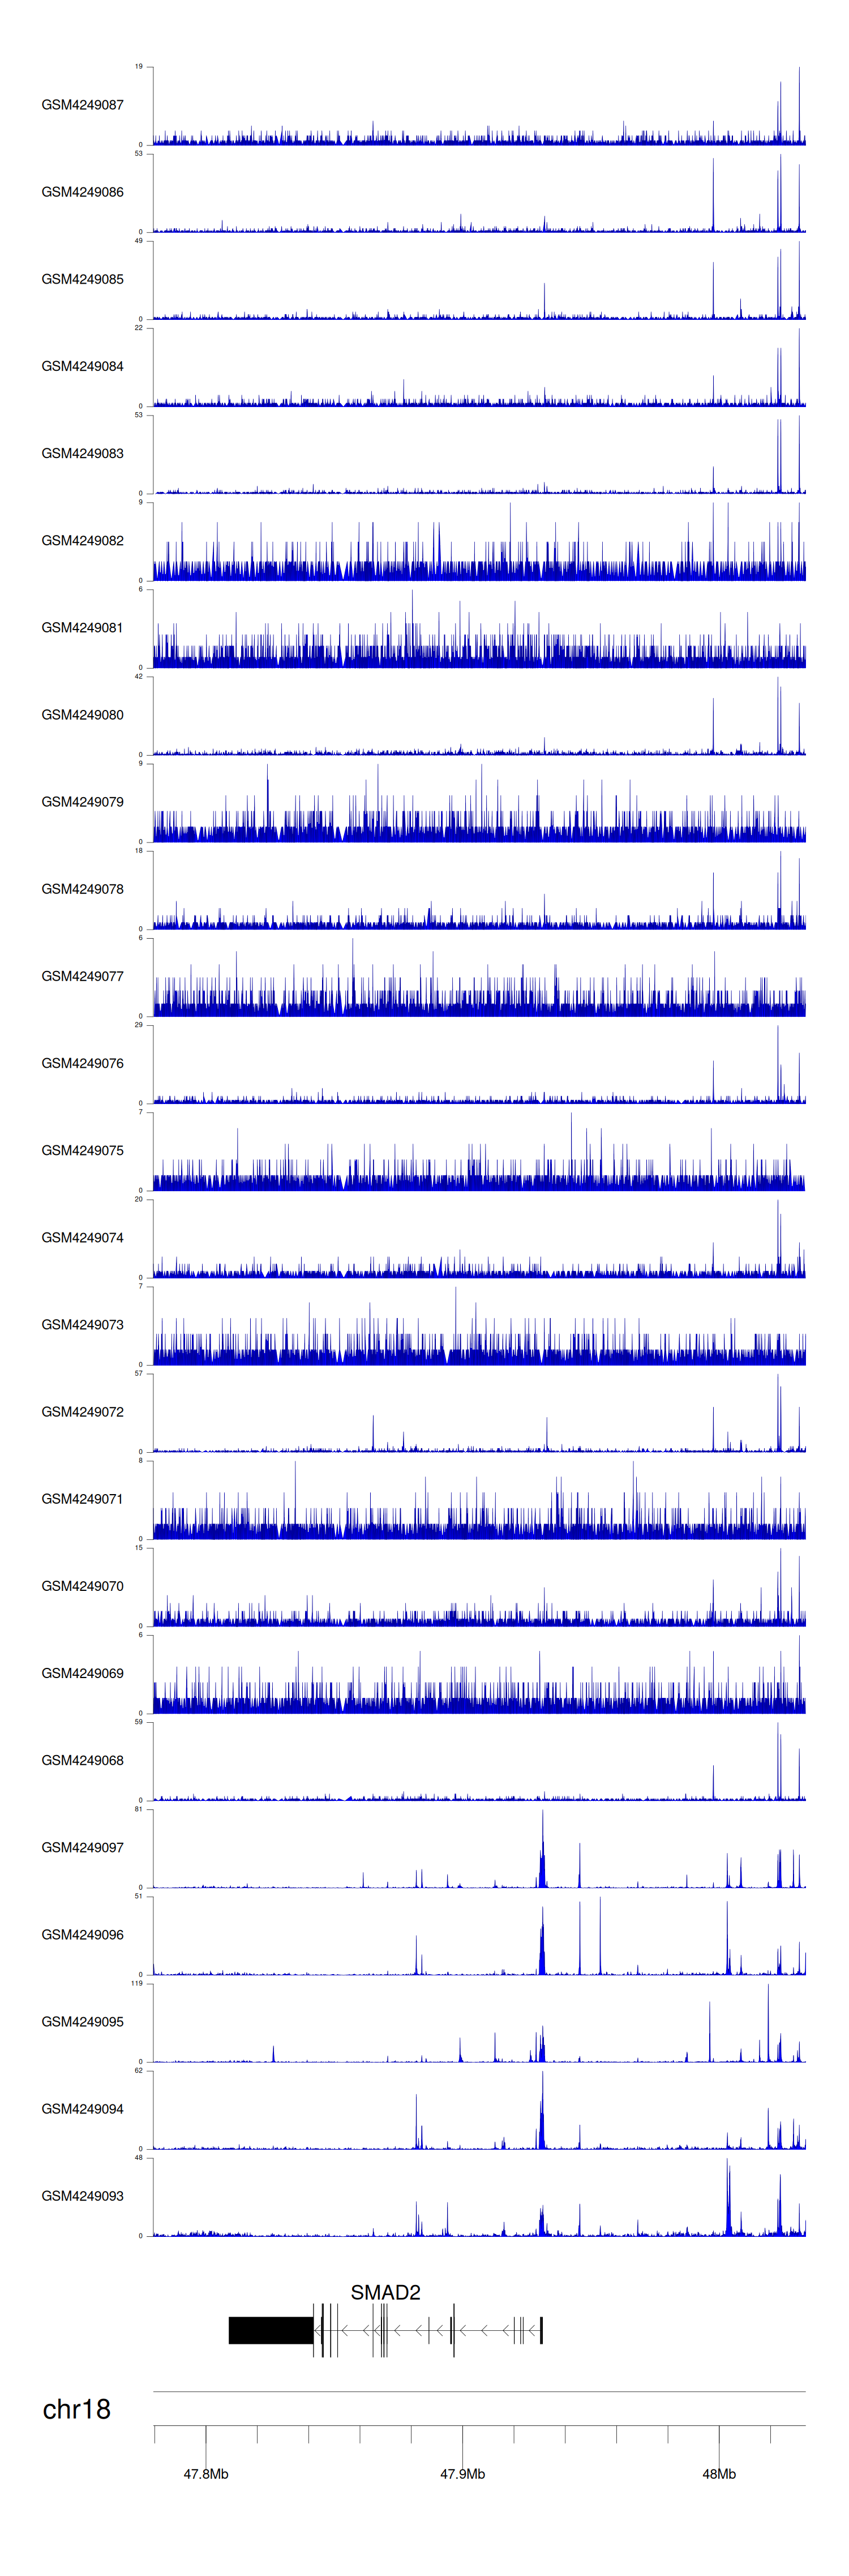
> Dataset: GSE143026 - SMAD2 peak across samples
|
Peak Plot
|
|
|
