Gene Information
|
Gene Name
|
CNN2 |
|
Gene ID
|
1265
|
|
Gene Full Name
|
calponin 2 |
|
Gene Alias
|
- |
|
Transcripts
|
ENSG00000064666
|
|
Virus
|
EBV |
|
Gene Type
|
protein-coding |
|
HPA Location Info
|
Actin filaments; 
|
|
Membrane Info
|
Plasma proteins, Predicted intracellular proteins |
|
Uniport_ID
|
Q99439
|
|
HGNC ID
|
HGNC:2156
|
|
OMIM ID
|
602373 |
|
Summary
|
The protein encoded by this gene, which can bind actin, calmodulin, troponin C, and tropomyosin, may function in the structural organization of actin filaments. The encoded protein could play a role in smooth muscle contraction and cell adhesion. Several pseudogenes of this gene have been identified, and are present on chromosomes 1, 2, 3, 6, 9, 11, 13, 15, 16, 21 and 22. Alternative splicing results in multiple transcript variants encoding different isoforms. [provided by RefSeq, Jan 2015] |
Target gene [CNN2] related to VISs 
Integration Table: if previous studies reported that target gene was altered by virus integration events, the overlap between VISs in this literature and Cistrome factors was listed in this section
| DVID |
Chromosome |
HM |
TFBS |
CA |
Sum of Overlapped Records |
Detail |
| 3000290 |
chr19 |
38 |
1 |
0 |
39 |
View |
Target gene [CNN2] related to Omics data
| Data ID |
Experiment type |
Sample number |
Platform |
|
GSE42867
|
Expression array |
12 |
[HG-U133_Plus_2] Affymetrix Human Genome U133 Plus 2.0 Array |
|
C GSE246060
|
Chip-seq |
26 |
Illumina NovaSeq 6000 (Homo sapiens) |
|
GSE45919
|
Expression array |
24 |
Illumina HumanHT-12 V4.0 expression beadchip |
|
GSE198332
|
Methylation profiling (Array) |
7 |
Infinium MethylationEPIC |
|
GSE223328
|
Expression array |
16 |
Agilent-072363 SurePrint G3 Human GE v3 8x60K Microarray 039494 [Probe Name Version] |
|
GSE208281
|
RNA-seq |
50 |
Illumina NextSeq 500 (Homo sapiens) |
|
GSE100458
|
Expression array |
14 |
[HG-U133_Plus_2] Affymetrix Human Genome U133 Plus 2.0 Array [CDF: Brainarray HGU133Plus2_Hs_ENTREZG_v21] |
|
C GSE198334
|
Chip-seq |
4 |
Illumina NextSeq 500 (Homo sapiens) |
|
GSE165194
|
RNA-seq |
3 |
Illumina NextSeq 500 (Homo sapiens) |
|
C GSE246059
|
ATAC-seq |
8 |
Illumina NextSeq 500 (Homo sapiens);Illumina NovaSeq 6000 (Homo sapiens) |
|
GSE177046
|
RNA-seq |
6 |
Illumina HiSeq 2000 (Homo sapiens) |
|
GSE135644
|
Expression array |
10 |
Sentrix Human-6 v2 Expression BeadChip |
|
C GSE225248
|
Chip-seq |
12 |
Illumina NextSeq 500 (Homo sapiens) |
|
GSE102203
|
Expression array |
10 |
[HuGene-2_0-st] Affymetrix Human Gene 2.0 ST Array [probe set (exon) version] |
|
GSE85599
|
Expression array |
17 |
[HTA-2_0] Affymetrix Human Transcriptome Array 2.0 [transcript (gene) version] |
|
GSE12452
|
Expression array |
41 |
[HG-U133_Plus_2] Affymetrix Human Genome U133 Plus 2.0 Array |
|
GSE58240
|
Expression array |
32 |
Illumina HumanHT-12 V4.0 expression beadchip |
|
GSE181906
|
RNA-seq |
24 |
Illumina NovaSeq 6000 (Homo sapiens) |
When the gene can detect a peak in the dataset, a peak plot will be displayed.
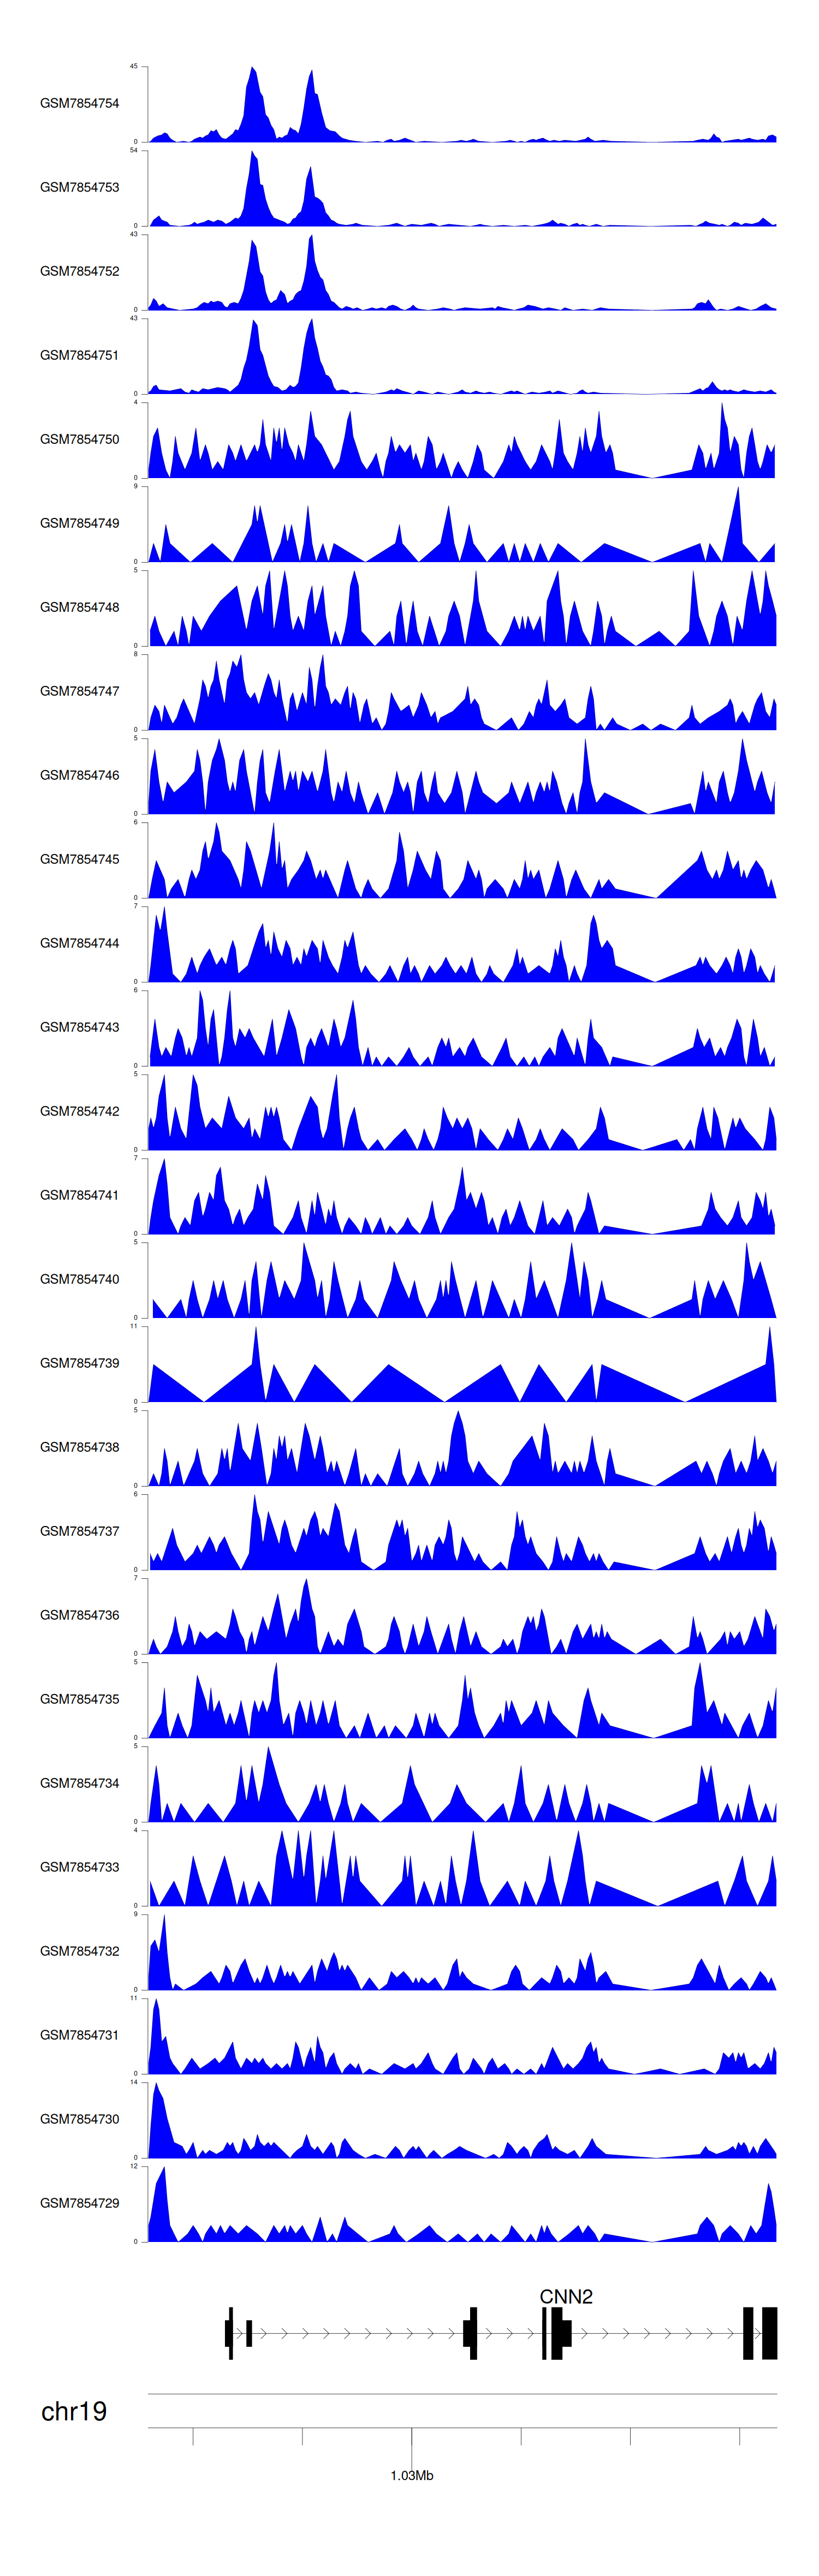
> Dataset: GSE246060 - CNN2 peak across samples
|
Peak Plot
|
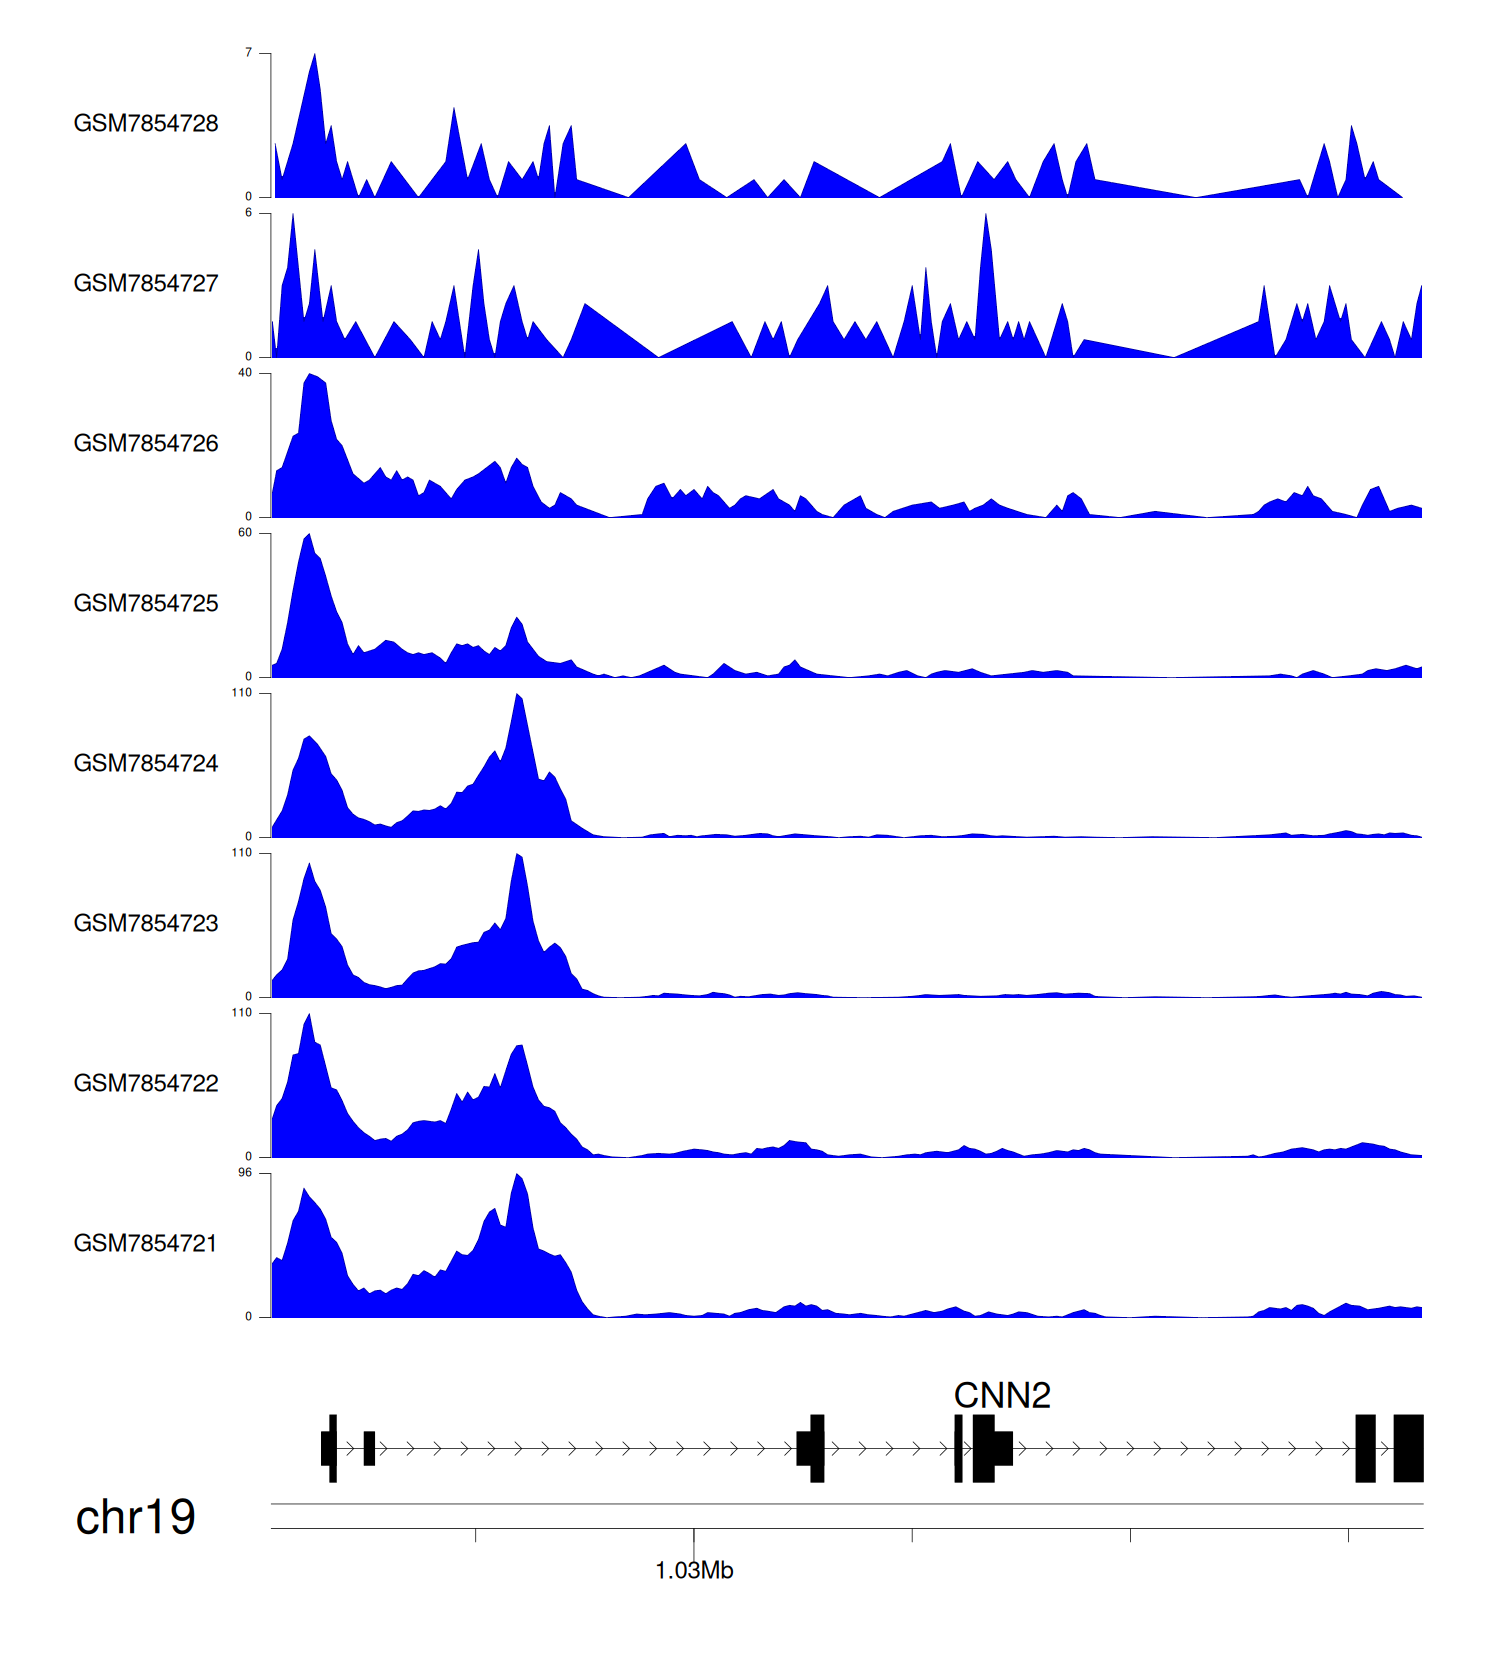
> Dataset: GSE198334 - CNN2 peak across samples
|
Peak Plot
|
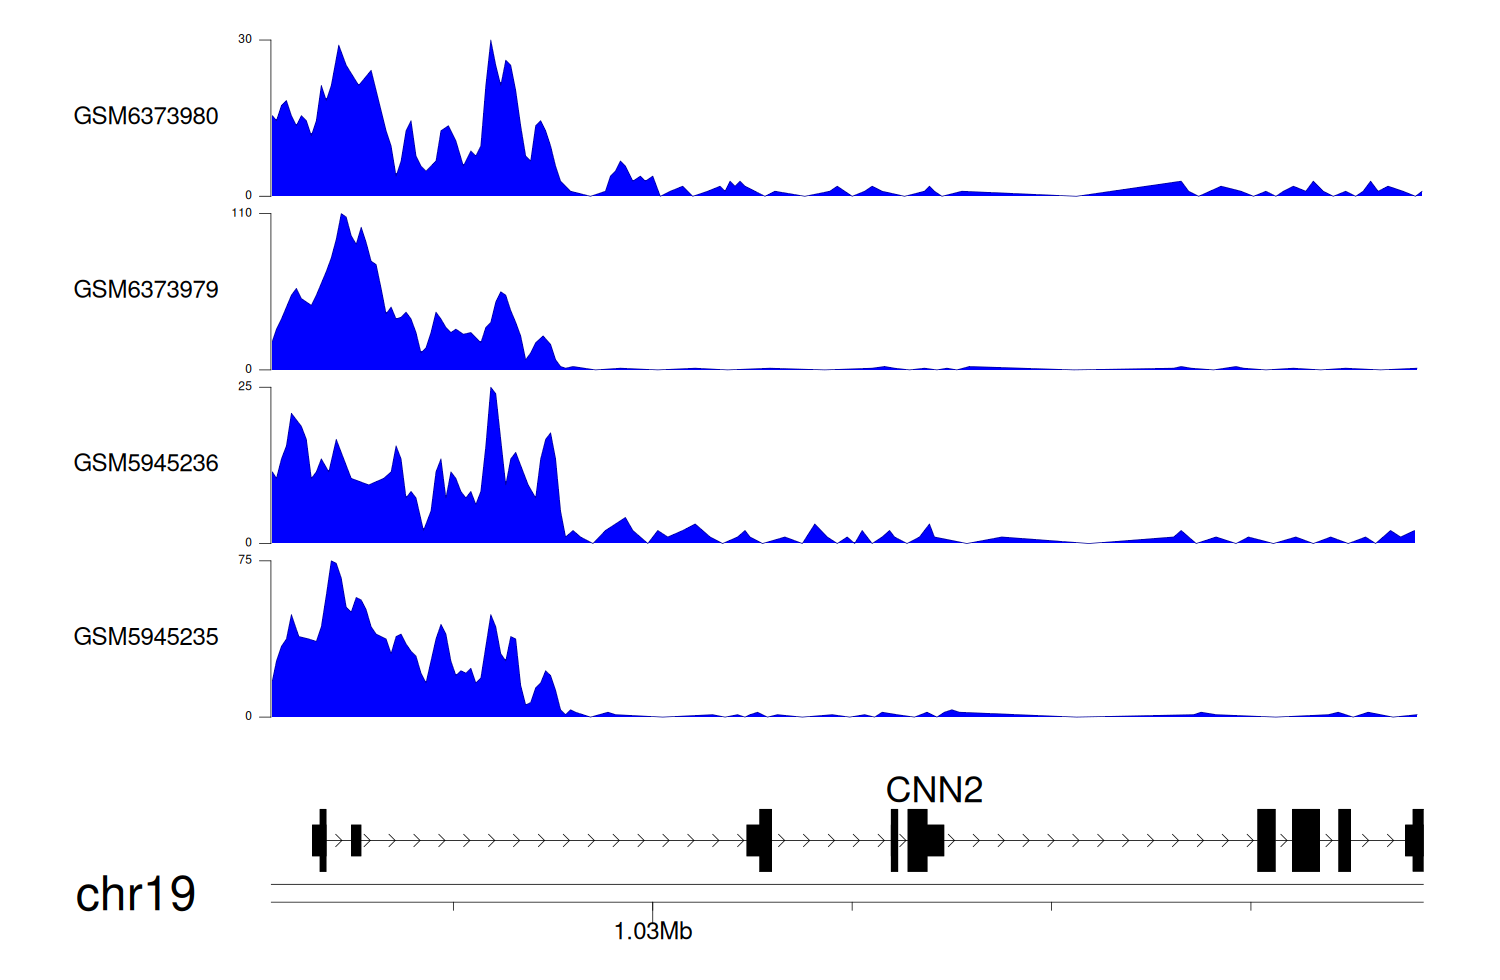
> Dataset: GSE246059 - CNN2 peak across samples
|
Peak Plot
|
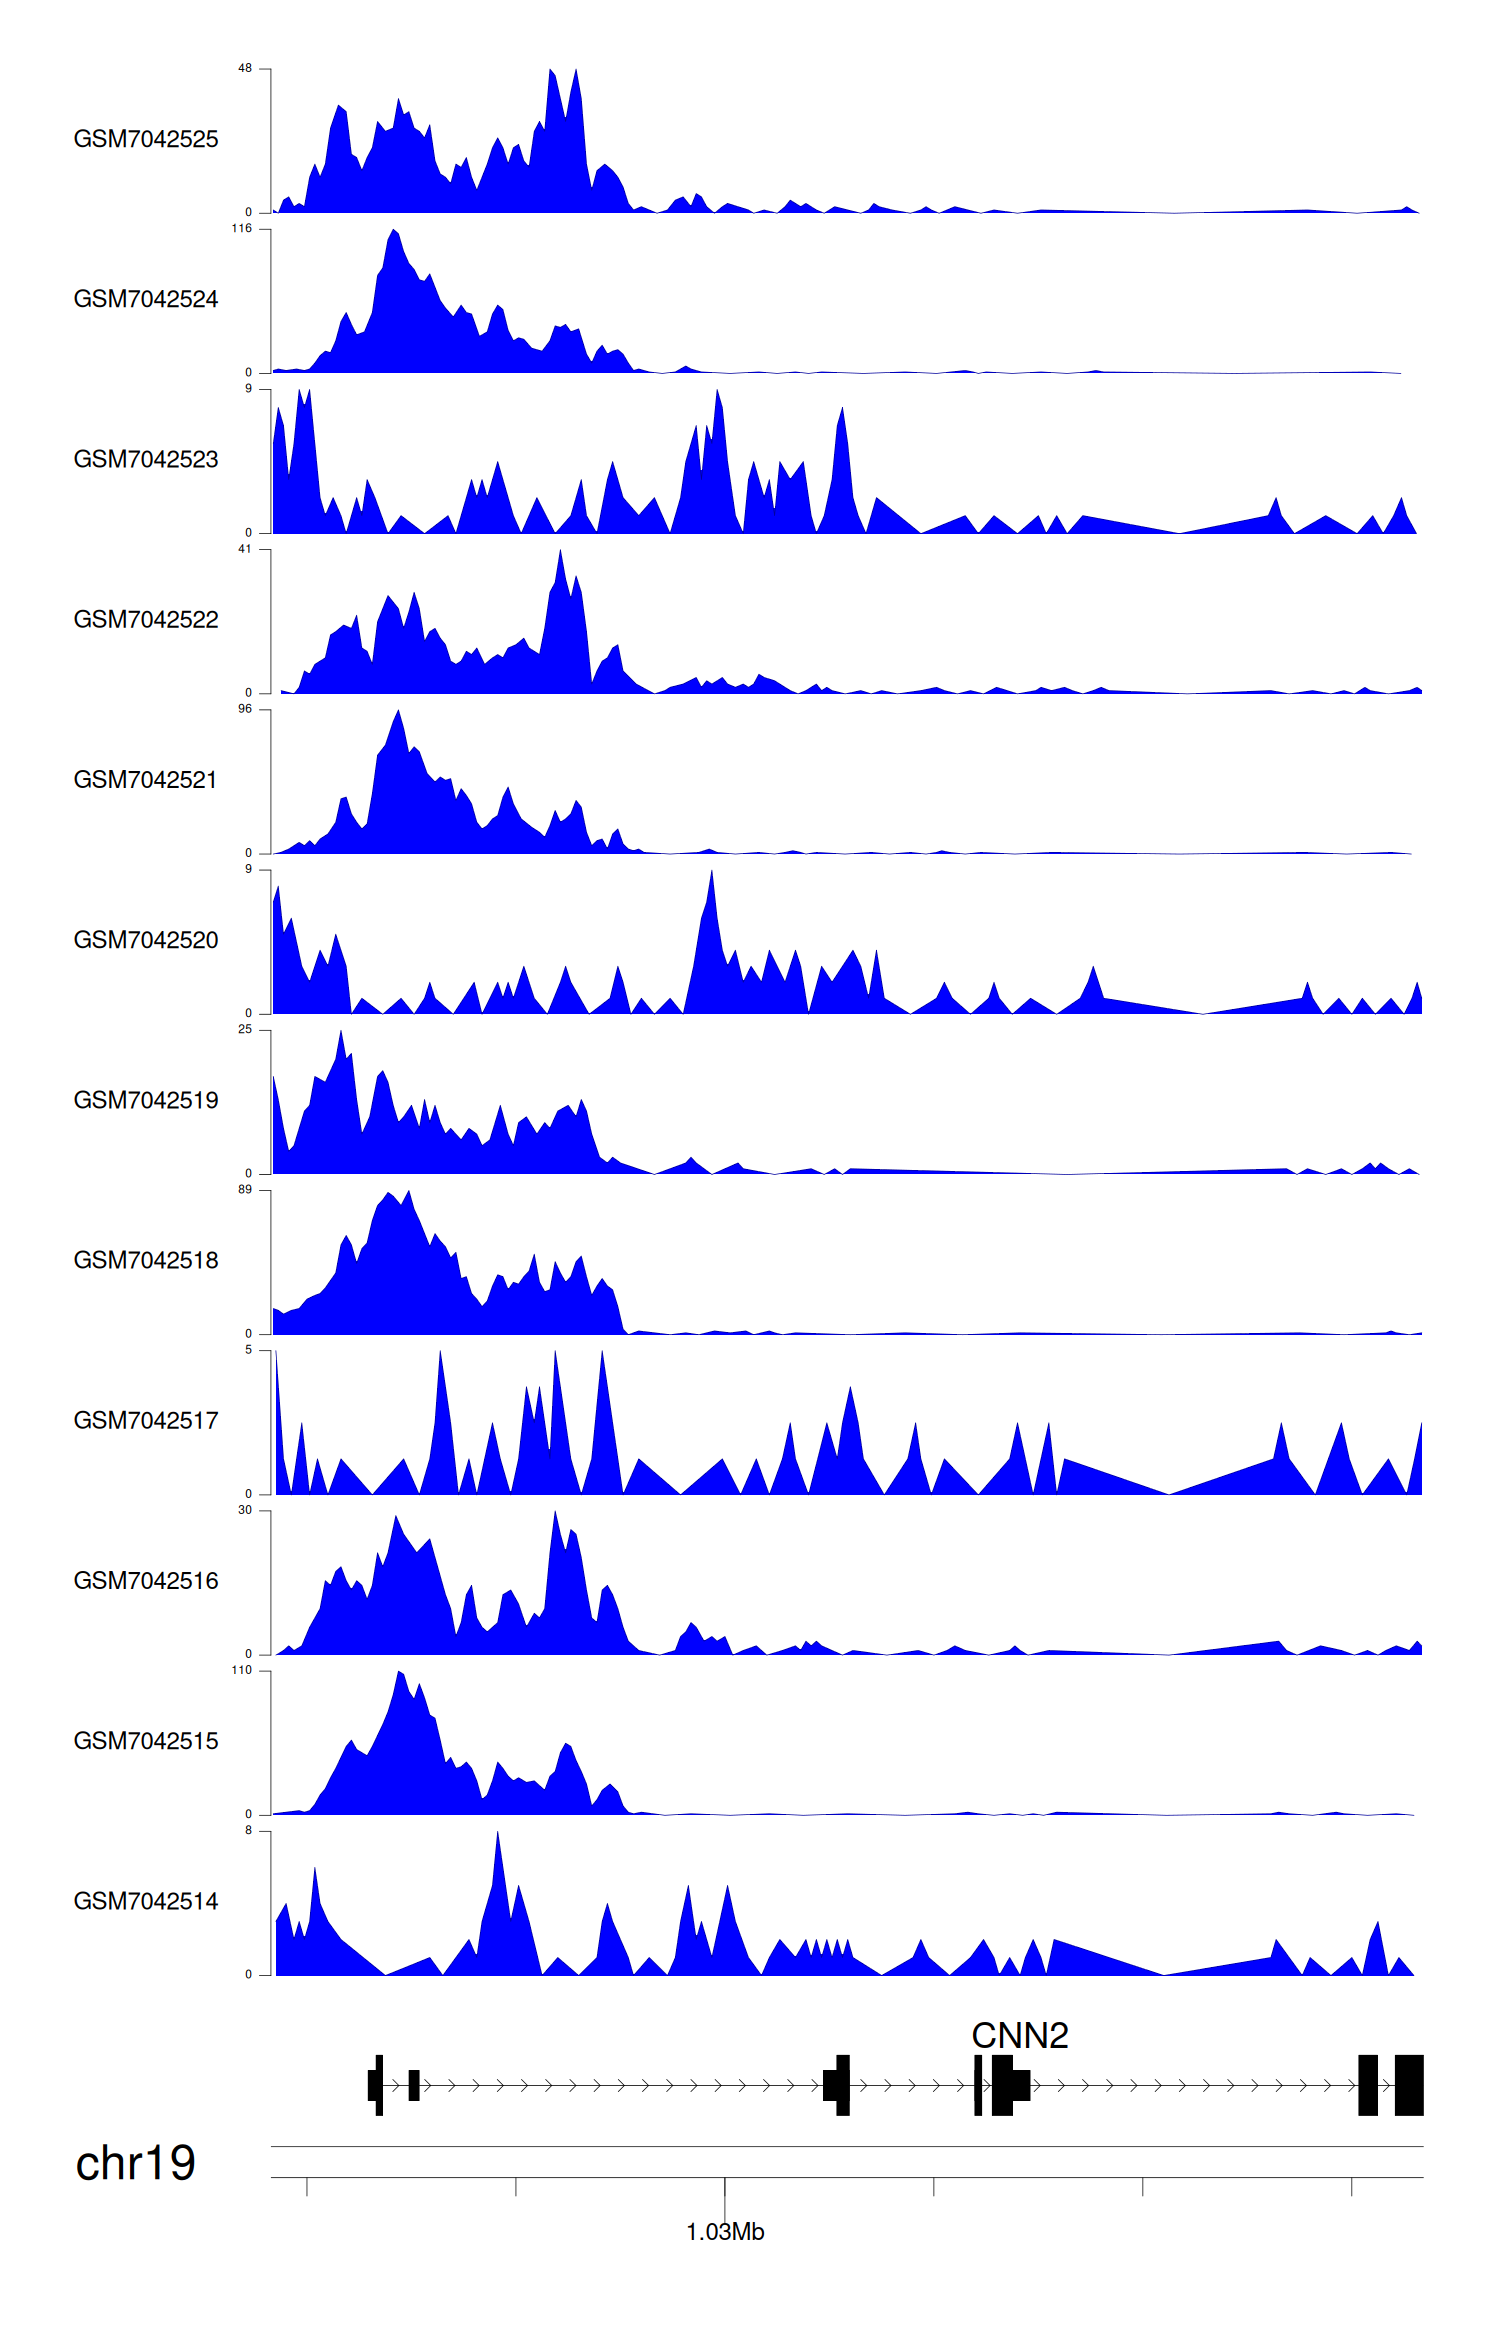
> Dataset: GSE225248 - CNN2 peak across samples
|
Peak Plot
|
|
|
