Gene Information
|
Gene Name
|
EEF1A1 |
|
Gene ID
|
1915
|
|
Gene Full Name
|
eukaryotic translation elongation factor 1 alpha 1 |
|
Gene Alias
|
CCS-3|CCS3|EE1A1|EEF-1|EEF1A|EF-Tu|EF1A|EF1A1|EF1alpha1|GRAF-1EF|LENG7|PTI1|eEF1A-1 |
|
Transcripts
|
ENSG00000156508
|
|
Virus
|
EBV |
|
Gene Type
|
protein-coding |
|
HPA Location Info
|
Cytosol; 
|
|
Membrane Info
|
Cancer-related genes, Metabolic proteins, Plasma proteins, Predicted intracellular proteins |
|
Uniport_ID
|
P68104
|
|
HGNC ID
|
HGNC:3189
|
|
OMIM ID
|
130590 |
|
Summary
|
This gene encodes an isoform of the alpha subunit of the elongation factor-1 complex, which is responsible for the enzymatic delivery of aminoacyl tRNAs to the ribosome. This isoform (alpha 1) is expressed in brain, placenta, lung, liver, kidney, and pancreas, and the other isoform (alpha 2) is expressed in brain, heart and skeletal muscle. This isoform is identified as an autoantigen in 66% of patients with Felty syndrome. This gene has been found to have multiple copies on many chromosomes, some of which, if not all, represent different pseudogenes. [provided by RefSeq, Jul 2008] |
Target gene [EEF1A1] related to VISs 
Integration Table: if previous studies reported that target gene was altered by virus integration events, the overlap between VISs in this literature and Cistrome factors was listed in this section
| DVID |
Chromosome |
HM |
TFBS |
CA |
Sum of Overlapped Records |
Detail |
| 3001133 |
chr6 |
385 |
43 |
1 |
429 |
View |
Target gene [EEF1A1] related to Omics data
| Data ID |
Experiment type |
Sample number |
Platform |
|
GSE42867
|
Expression array |
12 |
[HG-U133_Plus_2] Affymetrix Human Genome U133 Plus 2.0 Array |
|
C GSE246060
|
Chip-seq |
26 |
Illumina NovaSeq 6000 (Homo sapiens) |
|
GSE45919
|
Expression array |
24 |
Illumina HumanHT-12 V4.0 expression beadchip |
|
GSE198332
|
Methylation profiling (Array) |
7 |
Infinium MethylationEPIC |
|
GSE223328
|
Expression array |
16 |
Agilent-072363 SurePrint G3 Human GE v3 8x60K Microarray 039494 [Probe Name Version] |
|
GSE208281
|
RNA-seq |
50 |
Illumina NextSeq 500 (Homo sapiens) |
|
GSE100458
|
Expression array |
14 |
[HG-U133_Plus_2] Affymetrix Human Genome U133 Plus 2.0 Array [CDF: Brainarray HGU133Plus2_Hs_ENTREZG_v21] |
|
C GSE198334
|
Chip-seq |
4 |
Illumina NextSeq 500 (Homo sapiens) |
|
GSE165194
|
RNA-seq |
3 |
Illumina NextSeq 500 (Homo sapiens) |
|
C GSE246059
|
ATAC-seq |
8 |
Illumina NextSeq 500 (Homo sapiens);Illumina NovaSeq 6000 (Homo sapiens) |
|
GSE177046
|
RNA-seq |
6 |
Illumina HiSeq 2000 (Homo sapiens) |
|
GSE135644
|
Expression array |
10 |
Sentrix Human-6 v2 Expression BeadChip |
|
C GSE225248
|
Chip-seq |
12 |
Illumina NextSeq 500 (Homo sapiens) |
|
GSE102203
|
Expression array |
10 |
[HuGene-2_0-st] Affymetrix Human Gene 2.0 ST Array [probe set (exon) version] |
|
GSE85599
|
Expression array |
17 |
[HTA-2_0] Affymetrix Human Transcriptome Array 2.0 [transcript (gene) version] |
|
GSE12452
|
Expression array |
41 |
[HG-U133_Plus_2] Affymetrix Human Genome U133 Plus 2.0 Array |
|
GSE58240
|
Expression array |
32 |
Illumina HumanHT-12 V4.0 expression beadchip |
|
GSE181906
|
RNA-seq |
24 |
Illumina NovaSeq 6000 (Homo sapiens) |
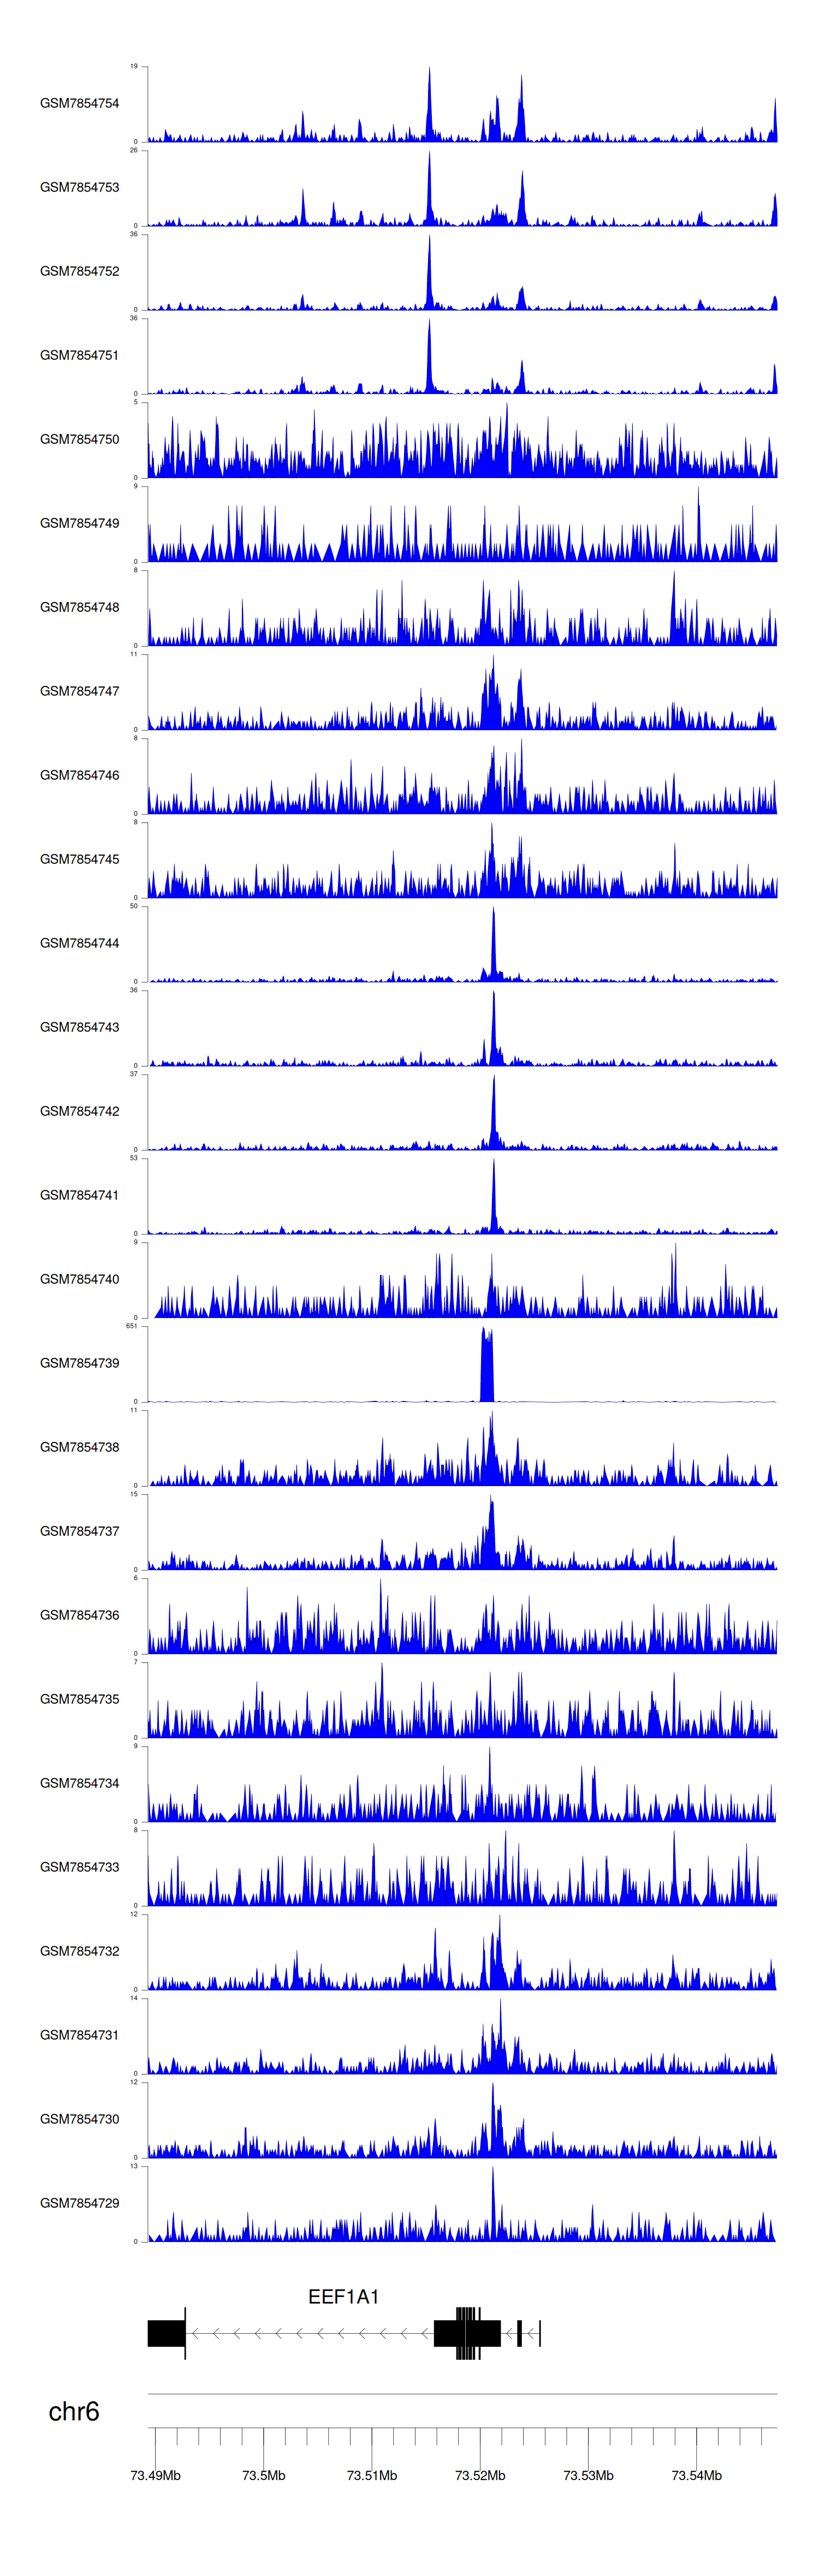
When the gene can detect a peak in the dataset, a peak plot will be displayed.
> Dataset: GSE246060 - EEF1A1 peak across samples
|
Peak Plot
|
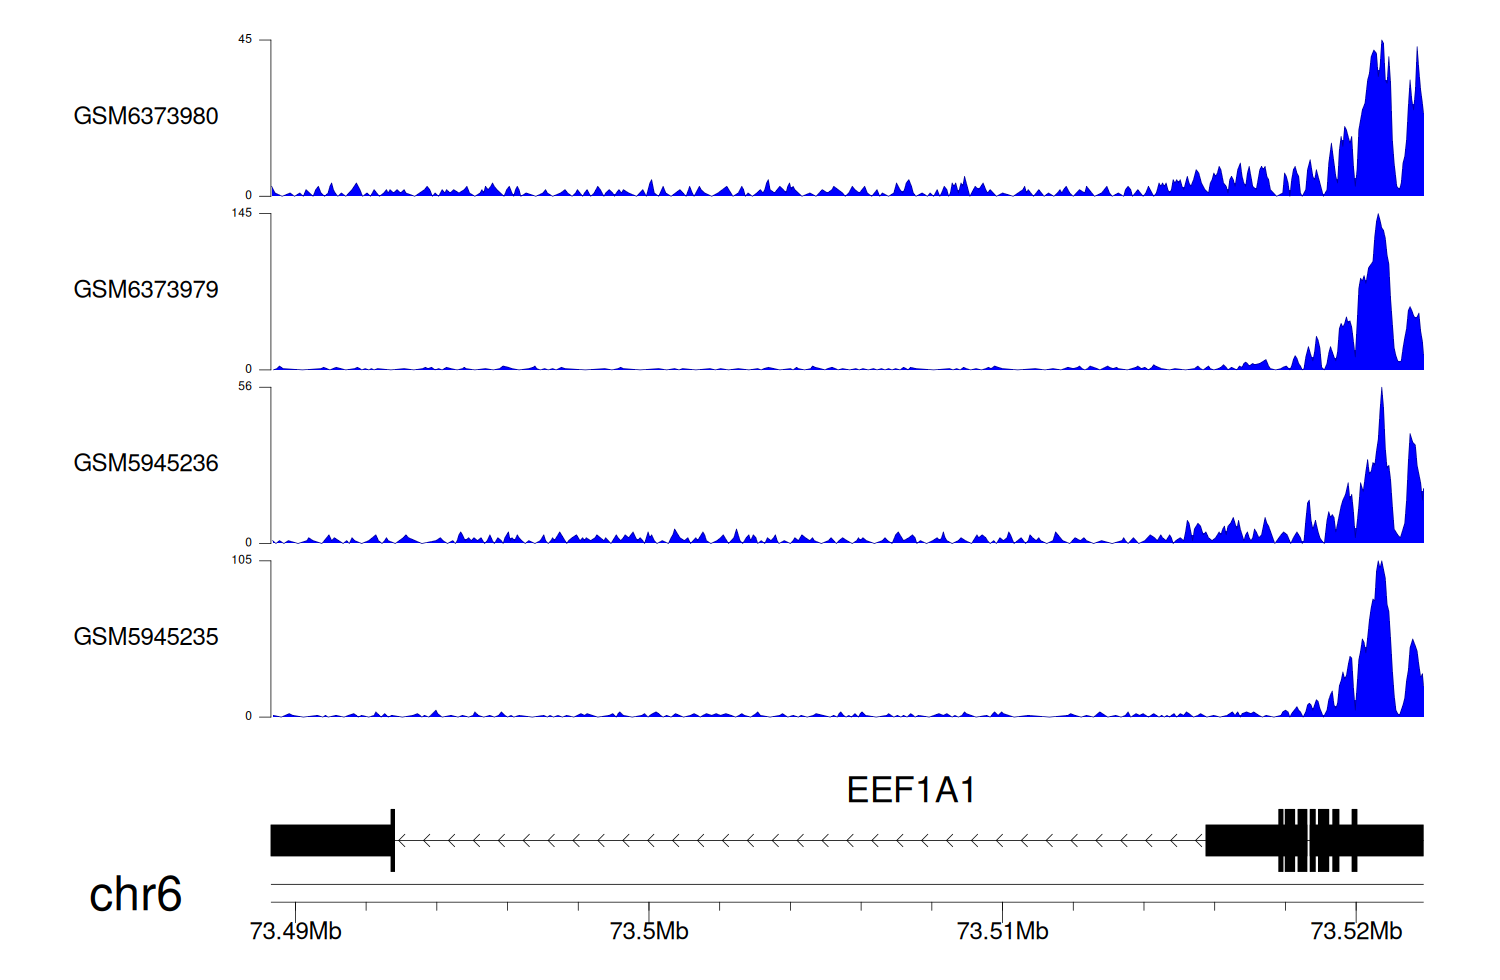
> Dataset: GSE198334 - EEF1A1 peak across samples
|
Peak Plot
|
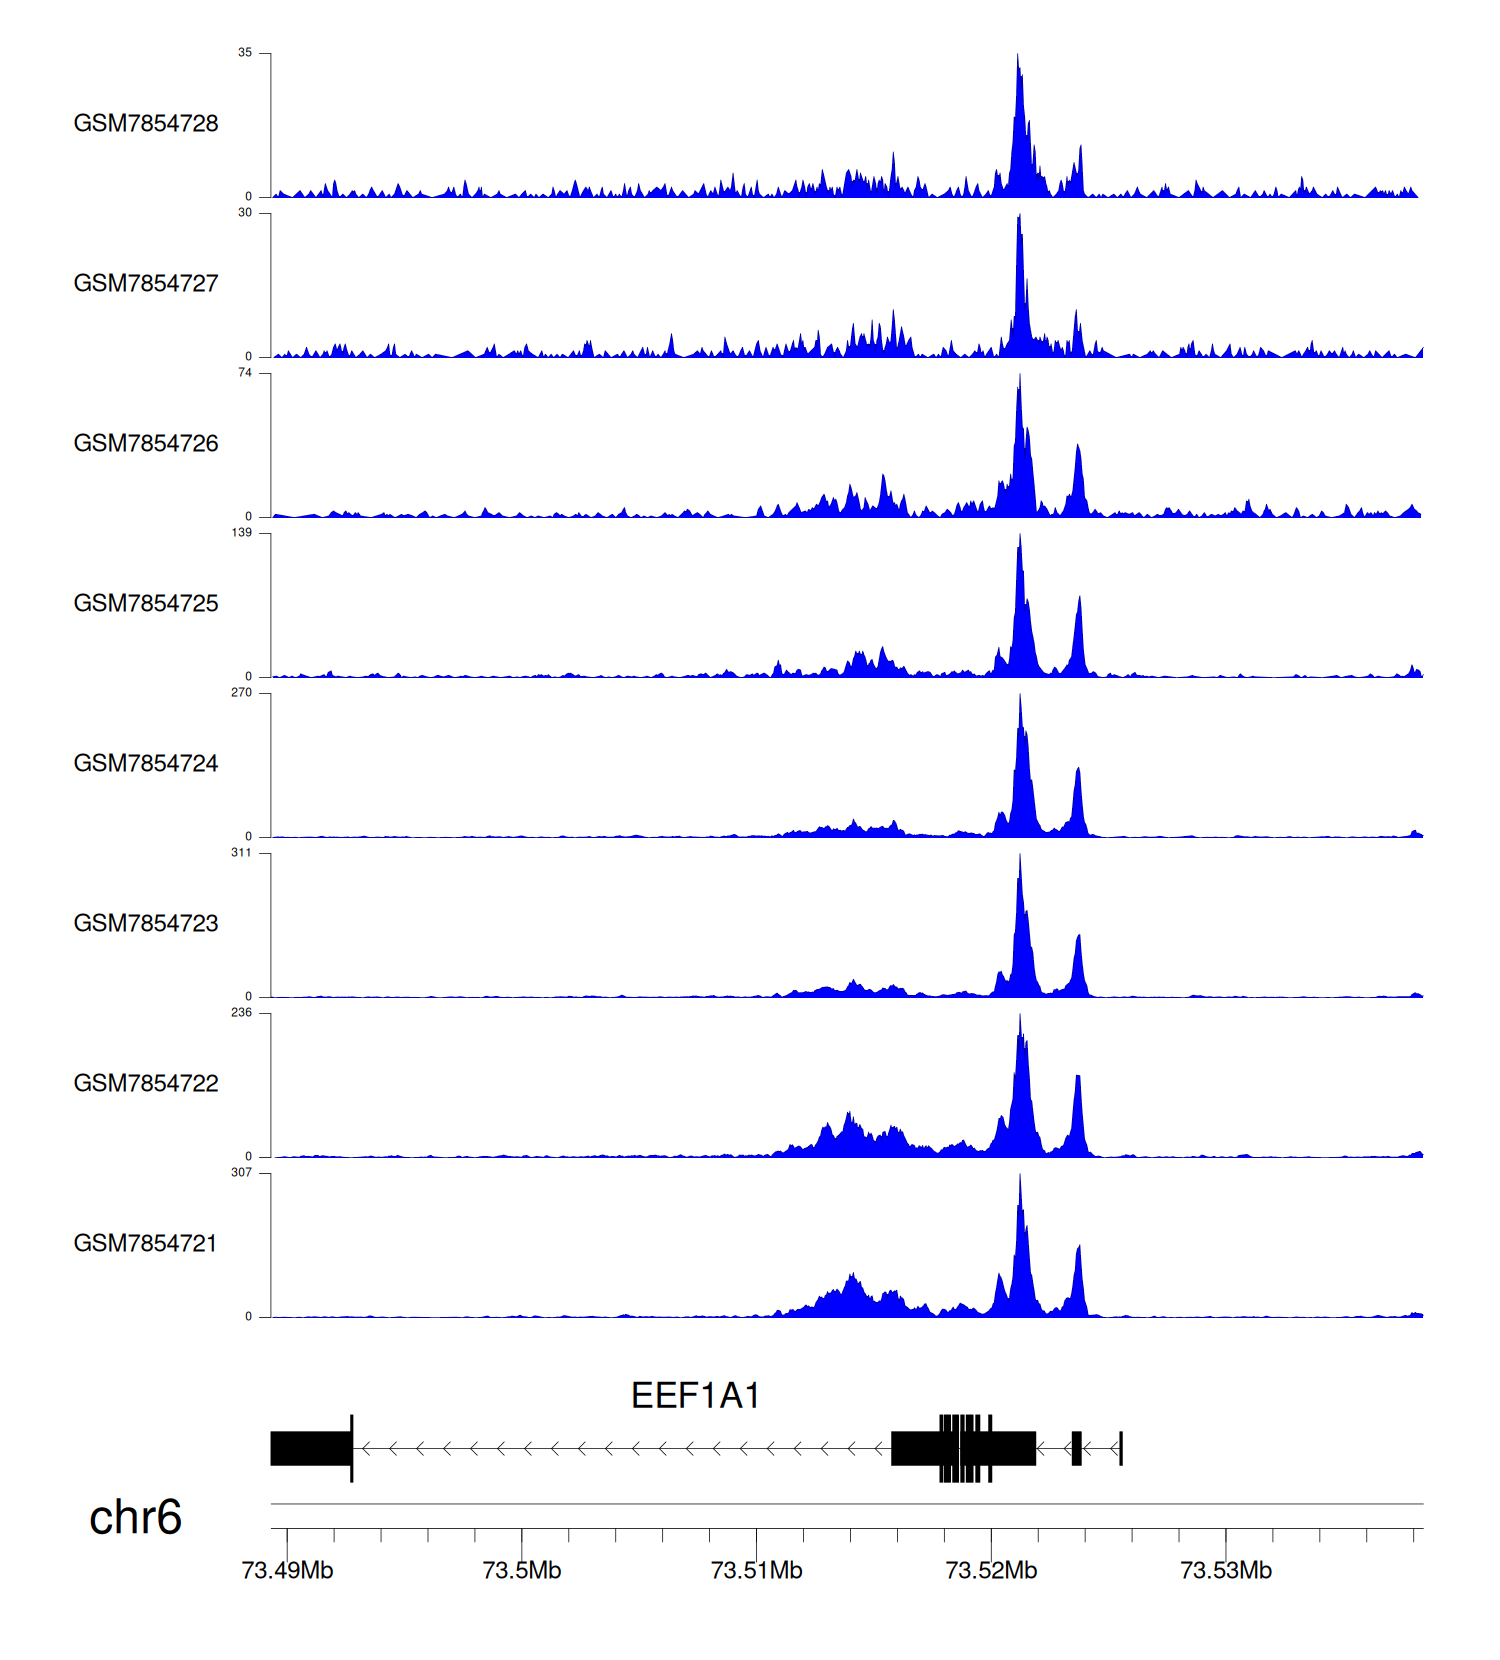
> Dataset: GSE246059 - EEF1A1 peak across samples
|
Peak Plot
|
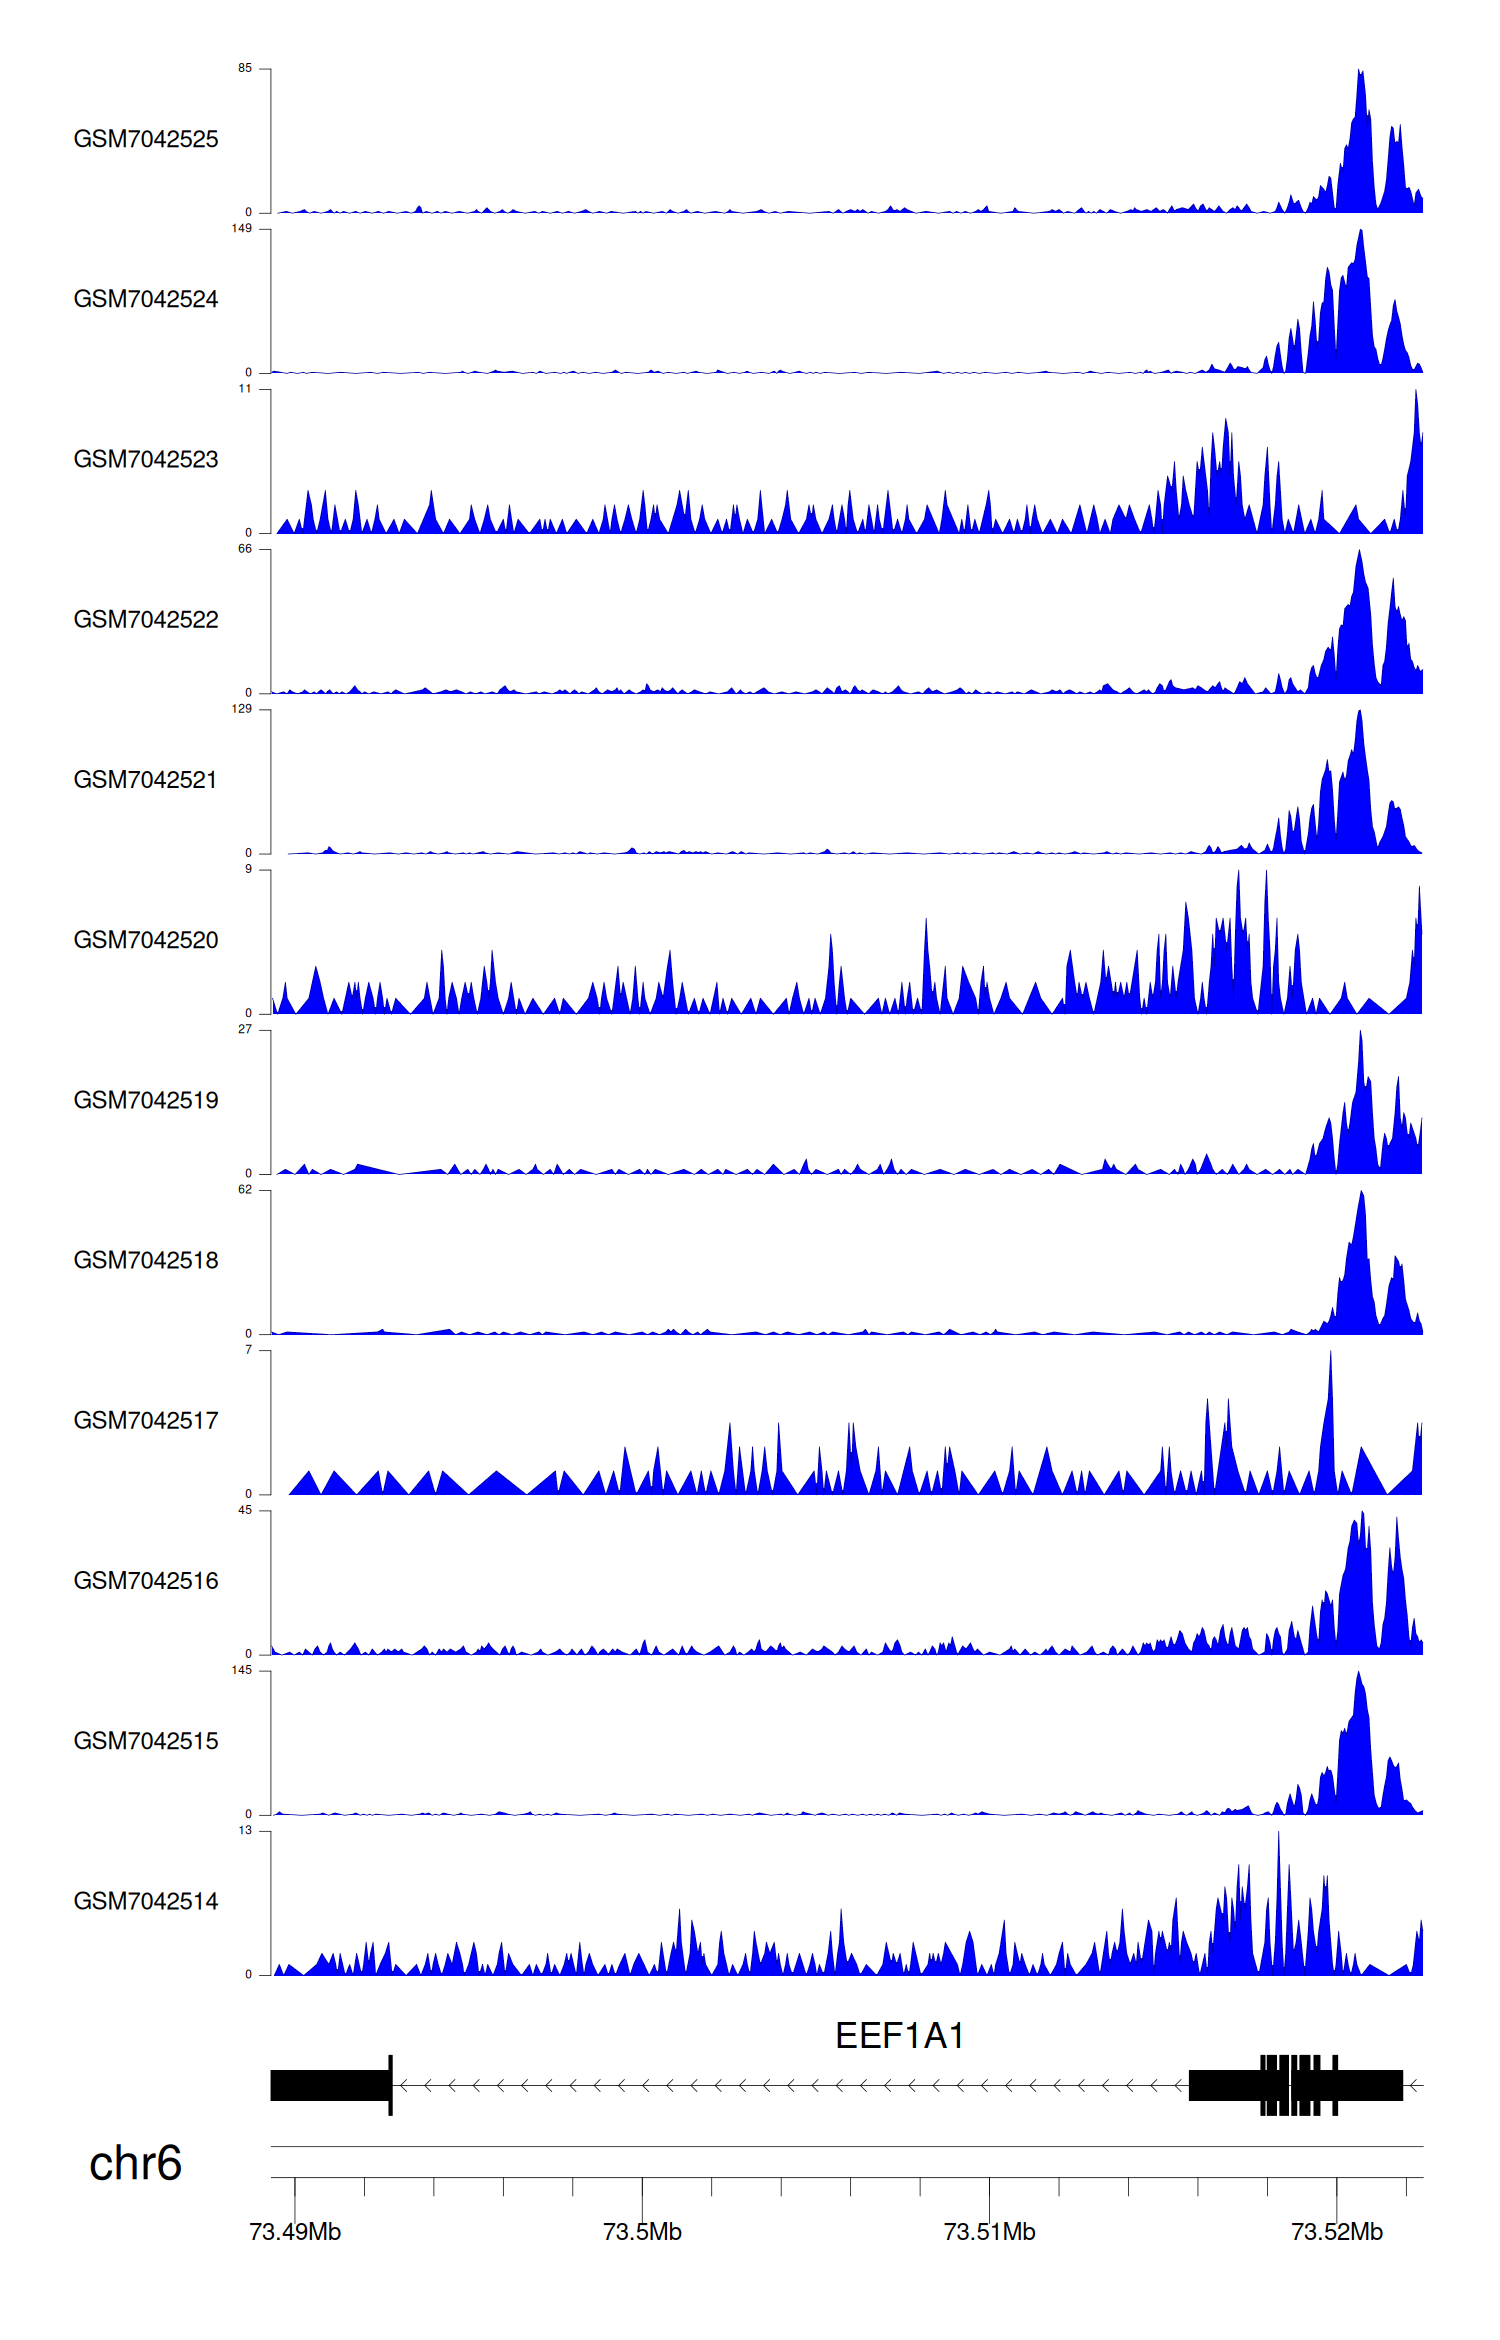
> Dataset: GSE225248 - EEF1A1 peak across samples
|
Peak Plot
|
|
|
