Gene Information
|
Gene Name
|
FIG4 |
|
Gene ID
|
9896
|
|
Gene Full Name
|
FIG4 phosphoinositide 5-phosphatase |
|
Gene Alias
|
ALS11|BOP|BTOP|CMT4J|KIAA0274|SAC3|YVS|dJ249I4.1 |
|
Transcripts
|
ENSG00000112367
|
|
Virus
|
EBV |
|
Gene Type
|
protein-coding |
|
HPA Location Info
|
Vesicles, Lipid droplets; 
|
|
Membrane Info
|
Disease related genes, Enzymes, Human disease related genes, Metabolic proteins, Potential drug targets, Predicted intracellular proteins, Predicted membrane proteins |
|
Uniport_ID
|
Q92562
|
|
HGNC ID
|
HGNC:16873
|
|
OMIM ID
|
609390 |
|
Summary
|
The protein encoded by this gene belongs to the SAC domain-containing protein gene family. The SAC domain, approximately 400 amino acids in length and consisting of seven conserved motifs, has been shown to possess phosphoinositide phosphatase activity. The yeast homolog, Sac1p, is involved in the regulation of various phosphoinositides, and affects diverse cellular functions such as actin cytoskeleton organization, Golgi function, and maintenance of vacuole morphology. Membrane-bound phosphoinositides function as signaling molecules and play a key role in vesicle trafficking in eukaryotic cells. Mutations in this gene have been associated with Charcot-Marie-Tooth disease, type 4J. [provided by RefSeq, Jul 2008] |
Target gene [FIG4] related to VISs 
Integration Table: if previous studies reported that target gene was altered by virus integration events, the overlap between VISs in this literature and Cistrome factors was listed in this section
| DVID |
Chromosome |
HM |
TFBS |
CA |
Sum of Overlapped Records |
Detail |
| 3000940 |
chr6 |
1 |
0 |
0 |
1 |
View |
Target gene [FIG4] related to Omics data
| Data ID |
Experiment type |
Sample number |
Platform |
|
GSE42867
|
Expression array |
12 |
[HG-U133_Plus_2] Affymetrix Human Genome U133 Plus 2.0 Array |
|
C GSE246060
|
Chip-seq |
26 |
Illumina NovaSeq 6000 (Homo sapiens) |
|
GSE45919
|
Expression array |
24 |
Illumina HumanHT-12 V4.0 expression beadchip |
|
GSE198332
|
Methylation profiling (Array) |
7 |
Infinium MethylationEPIC |
|
GSE223328
|
Expression array |
16 |
Agilent-072363 SurePrint G3 Human GE v3 8x60K Microarray 039494 [Probe Name Version] |
|
GSE208281
|
RNA-seq |
50 |
Illumina NextSeq 500 (Homo sapiens) |
|
GSE100458
|
Expression array |
14 |
[HG-U133_Plus_2] Affymetrix Human Genome U133 Plus 2.0 Array [CDF: Brainarray HGU133Plus2_Hs_ENTREZG_v21] |
|
C GSE198334
|
Chip-seq |
4 |
Illumina NextSeq 500 (Homo sapiens) |
|
GSE165194
|
RNA-seq |
3 |
Illumina NextSeq 500 (Homo sapiens) |
|
C GSE246059
|
ATAC-seq |
8 |
Illumina NextSeq 500 (Homo sapiens);Illumina NovaSeq 6000 (Homo sapiens) |
|
GSE177046
|
RNA-seq |
6 |
Illumina HiSeq 2000 (Homo sapiens) |
|
C GSE225248
|
Chip-seq |
12 |
Illumina NextSeq 500 (Homo sapiens) |
|
GSE102203
|
Expression array |
10 |
[HuGene-2_0-st] Affymetrix Human Gene 2.0 ST Array [probe set (exon) version] |
|
GSE85599
|
Expression array |
17 |
[HTA-2_0] Affymetrix Human Transcriptome Array 2.0 [transcript (gene) version] |
|
GSE12452
|
Expression array |
41 |
[HG-U133_Plus_2] Affymetrix Human Genome U133 Plus 2.0 Array |
|
GSE58240
|
Expression array |
32 |
Illumina HumanHT-12 V4.0 expression beadchip |
|
GSE181906
|
RNA-seq |
24 |
Illumina NovaSeq 6000 (Homo sapiens) |
When the gene can detect a peak in the dataset, a peak plot will be displayed.
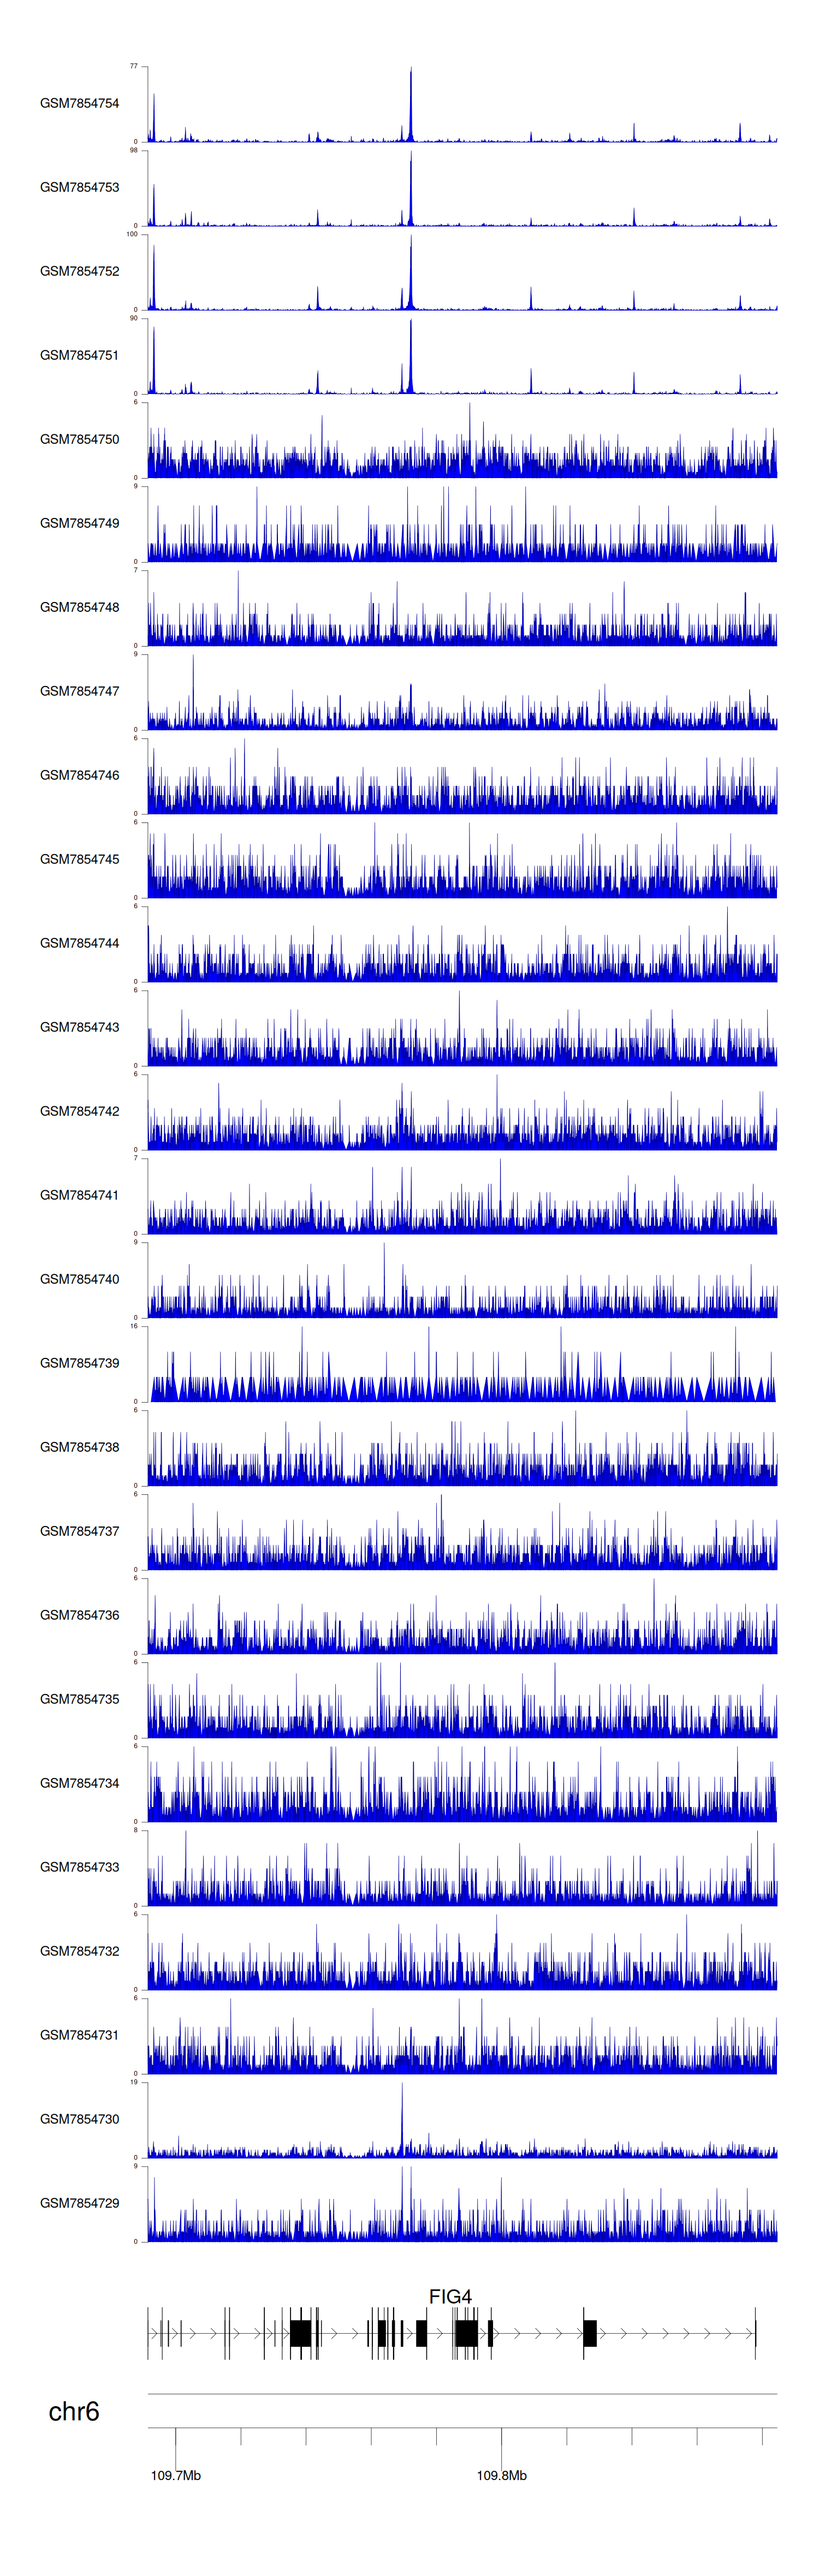
> Dataset: GSE246060 - FIG4 peak across samples
|
Peak Plot
|
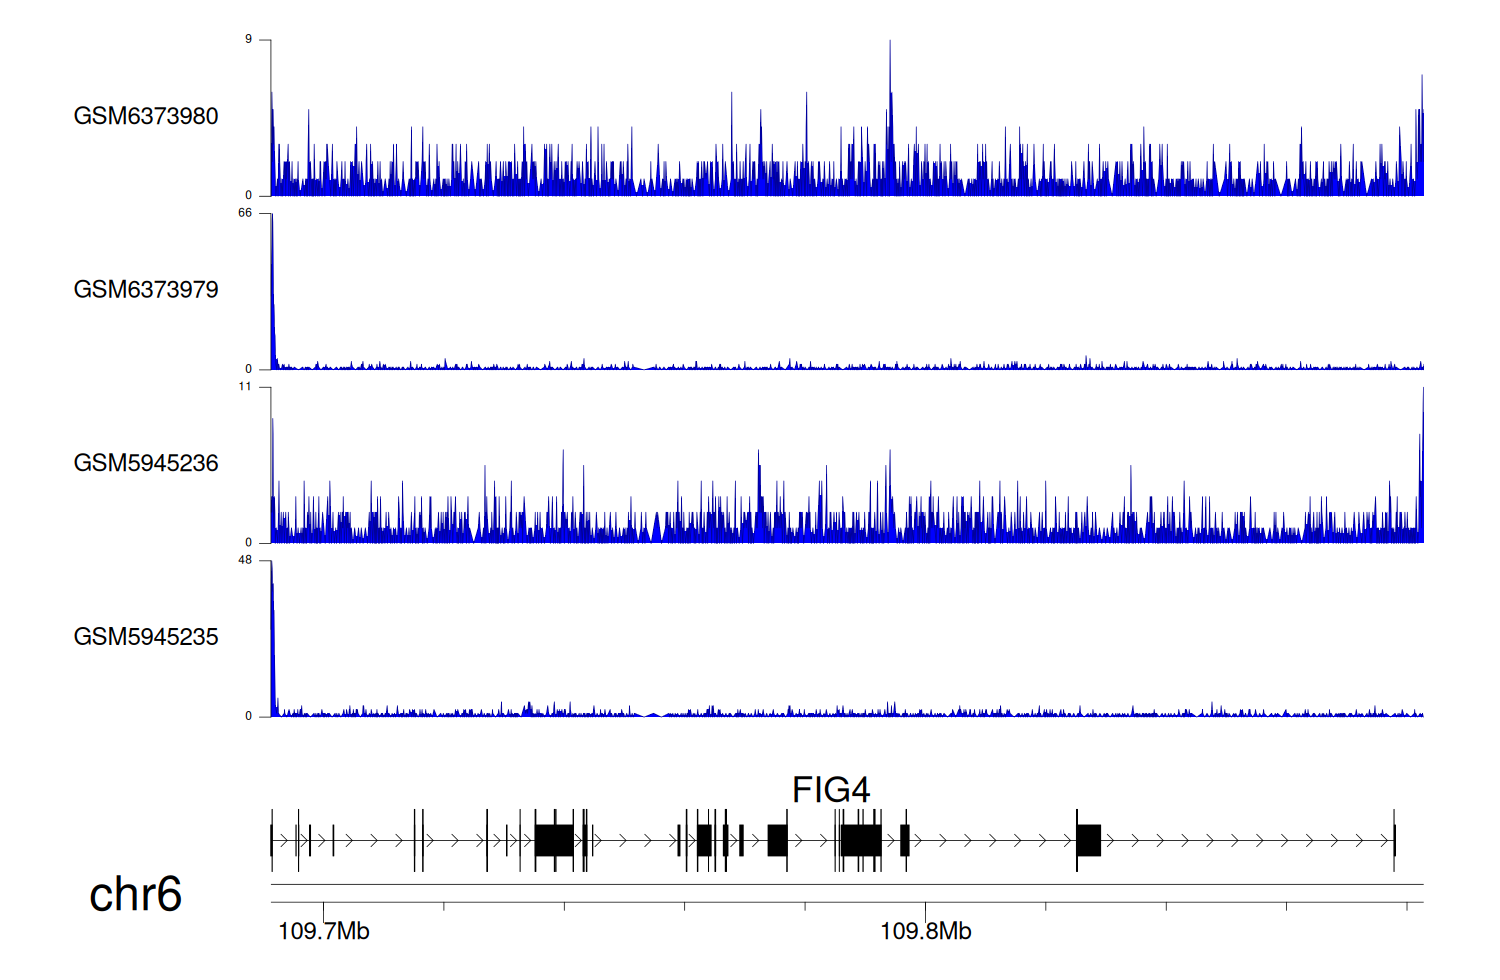
> Dataset: GSE198334 - FIG4 peak across samples
|
Peak Plot
|
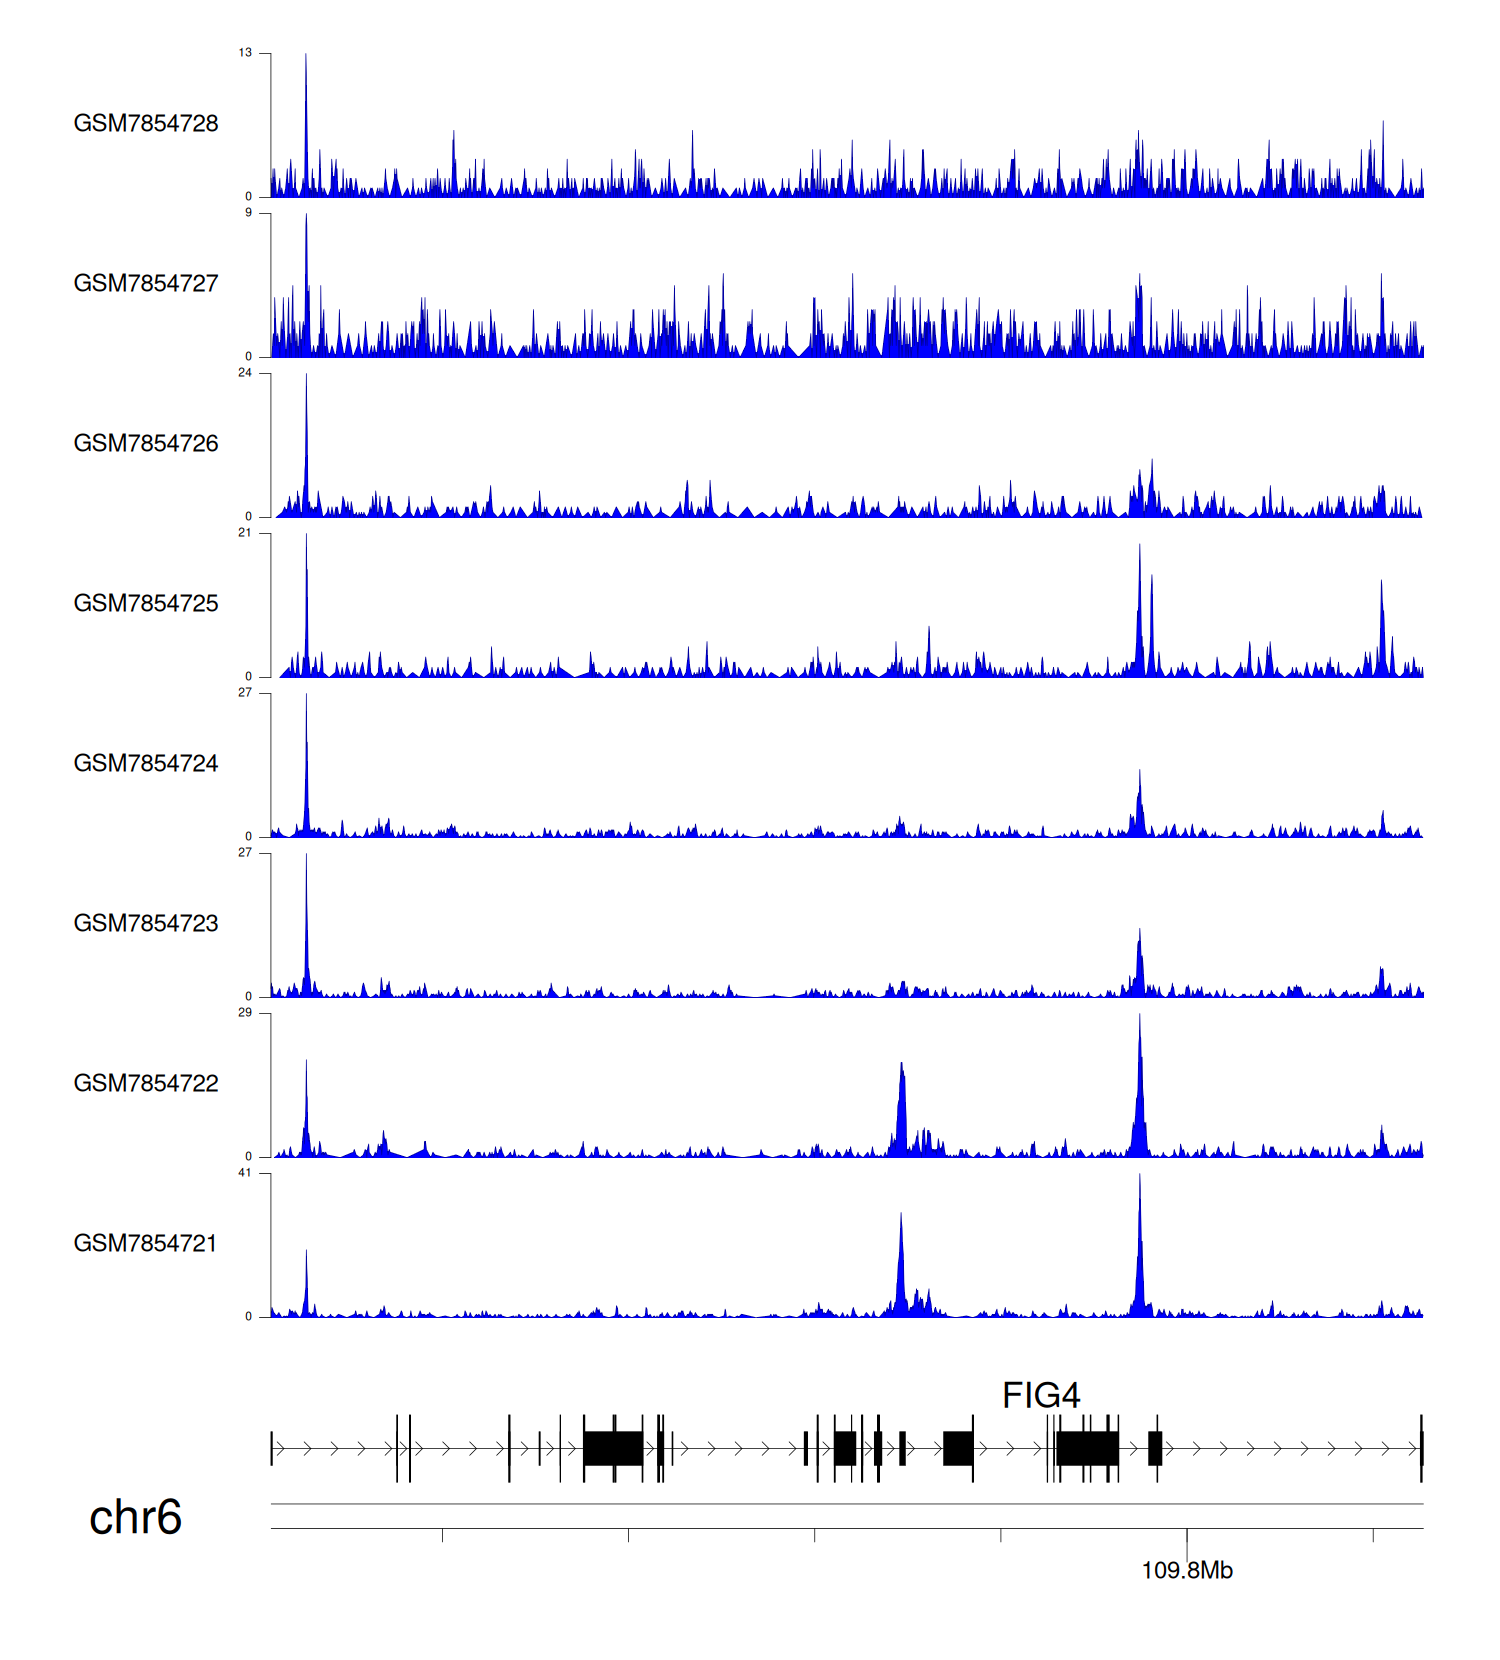
> Dataset: GSE246059 - FIG4 peak across samples
|
Peak Plot
|
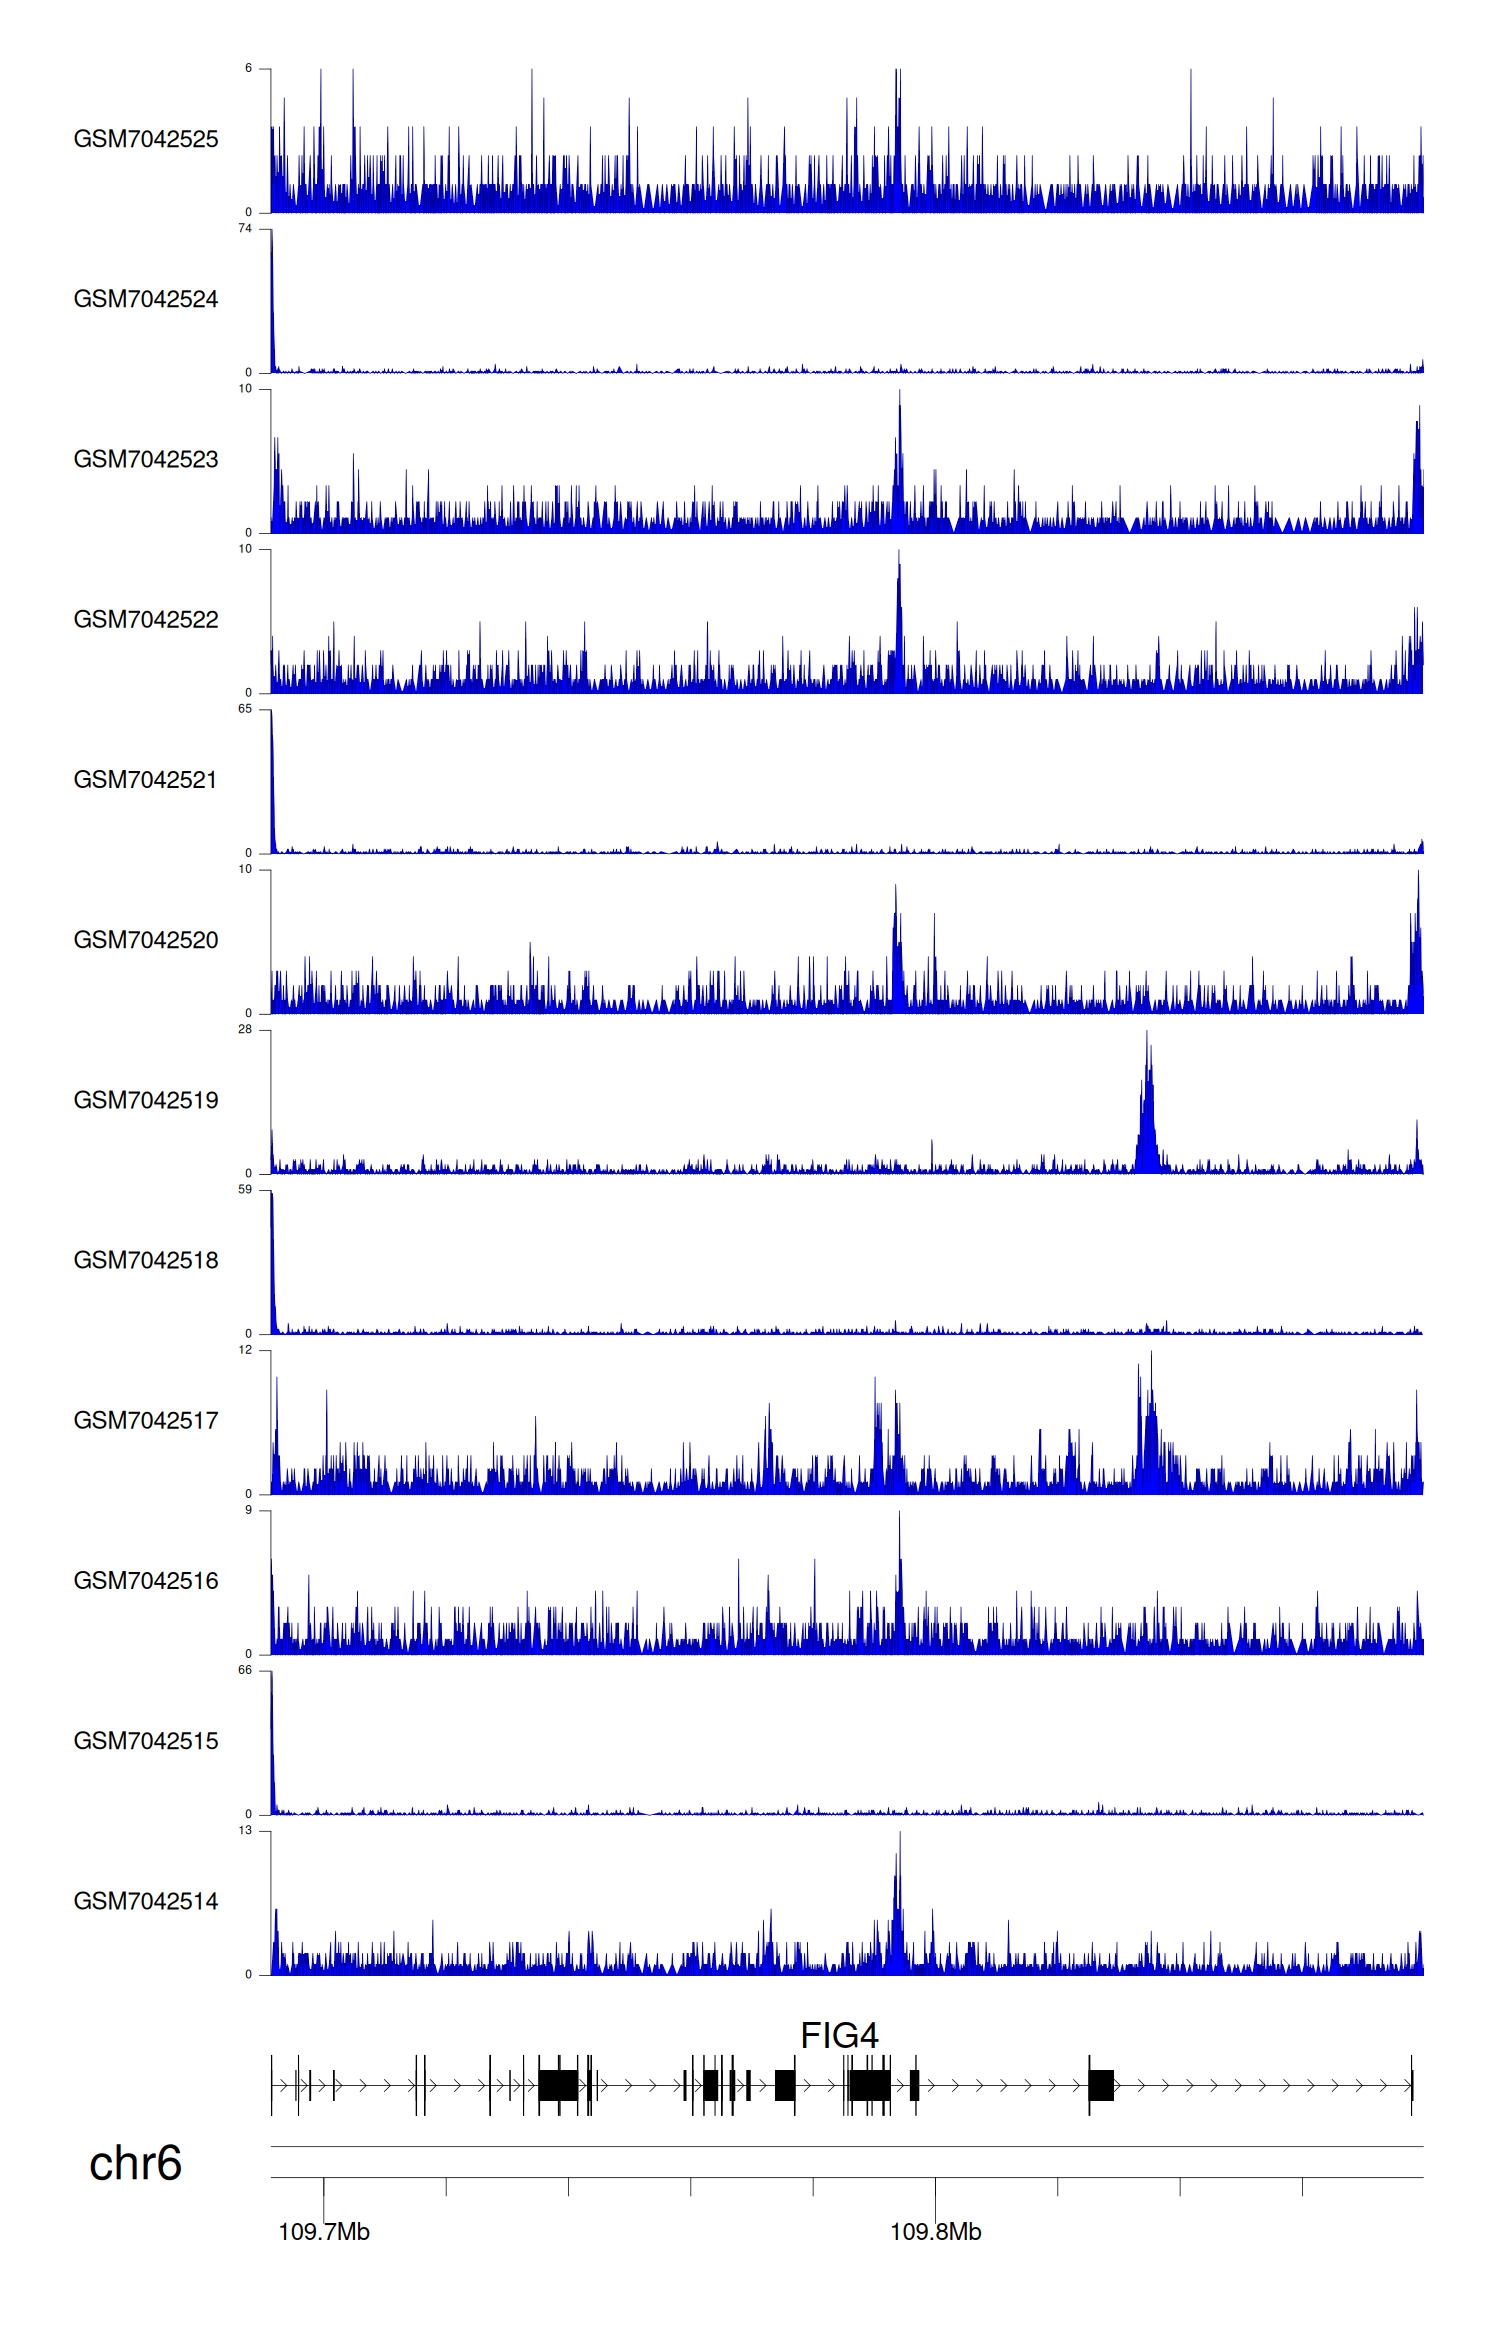
> Dataset: GSE225248 - FIG4 peak across samples
|
Peak Plot
|
|
|
