Gene Information
|
Gene Name
|
MID1 |
|
Gene ID
|
4281
|
|
Gene Full Name
|
midline 1 |
|
Gene Alias
|
BBBG1|FXY|GBBB|GBBB1|MIDIN|OGS1|OS|OSX|RNF59|TRIM18|XPRF|ZNFXY |
|
Transcripts
|
ENSG00000101871
|
|
Virus
|
HIV |
|
Gene Type
|
protein-coding |
|
HPA Location Info
|
Centriolar satellite;Golgi apparatus, Cytosol; 
|
|
Membrane Info
|
Disease related genes, Enzymes, Human disease related genes, Metabolic proteins, Potential drug targets, Predicted intracellular proteins, Predicted membrane proteins |
|
Uniport_ID
|
O15344
|
|
HGNC ID
|
HGNC:7095
|
|
OMIM ID
|
300552 |
|
Summary
|
The protein encoded by this gene is a member of the tripartite motif (TRIM) family, also known as the 'RING-B box-coiled coil' (RBCC) subgroup of RING finger proteins. The TRIM motif includes three zinc-binding domains, a RING, a B-box type 1 and a B-box type 2, and a coiled-coil region. This protein forms homodimers which associate with microtubules in the cytoplasm. The protein is likely involved in the formation of multiprotein structures acting as anchor points to microtubules. Mutations in this gene have been associated with the X-linked form of Opitz syndrome, which is characterized by midline abnormalities such as cleft lip, laryngeal cleft, heart defects, hypospadias, and agenesis of the corpus callosum. This gene was also the first example of a gene subject to X inactivation in human while escaping it in mouse. Alternative promoter use, alternative splicing and alternative polyadenylation result in multiple transcript variants that have different tissue specificities. [provided by RefSeq, Dec 2016] |
Target gene [MID1] related to VISs 
Integration Table: if previous studies reported that target gene was altered by virus integration events, the overlap between VISs in this literature and Cistrome factors was listed in this section
| DVID |
Chromosome |
HM |
TFBS |
CA |
Sum of Overlapped Records |
Detail |
| 4006056 |
chrX |
3 |
24 |
0 |
27 |
View |
| 4016053 |
chrX |
0 |
0 |
0 |
0 |
View |
Target gene [MID1] related to Omics data
| Data ID |
Experiment type |
Sample number |
Platform |
|
GSE99737
|
RNA-seq |
9 |
Illumina HiSeq 2500 (Homo sapiens) |
|
GSE144332
|
RNA-seq |
75 |
NextSeq 550 (Homo sapiens) |
|
C GSE165705
|
Chip-seq |
30 |
Illumina NovaSeq 6000 (Homo sapiens) |
|
GSE164264
|
RNA-seq |
6 |
BGISEQ-500 (Homo sapiens) |
|
GSE262621
|
RNA-seq |
70 |
Illumina NovaSeq 6000 (Homo sapiens) |
|
GSE128121
|
RNA-seq |
16 |
Illumina HiSeq 4000 (Homo sapiens) |
|
GSE162914
|
RNA-seq |
211 |
Illumina HiSeq 2500 (Homo sapiens) |
|
GSE279982
|
Methylation profiling (Array) |
576 |
Infinium MethylationEPIC |
|
C GSE144329
|
ATAC-seq |
96 |
NextSeq 550 (Homo sapiens) |
|
GSE205204
|
RNA-seq |
14 |
Illumina NovaSeq 6000 (Homo sapiens) |
|
GSE125686
|
RNA-seq |
62 |
Illumina HiSeq 2000 (Homo sapiens);Illumina HiSeq 2500 (Homo sapiens);Illumina NextSeq 500 (Homo sapiens) |
|
C GSE220859
|
Chip-seq |
11 |
Illumina NovaSeq 6000 (Homo sapiens) |
|
GSE165708
|
RNA-seq |
100 |
Illumina HiSeq 4000 (Homo sapiens) |
|
C GSE211651
|
Chip-seq;RNA-seq;PRO-seq |
39 |
Illumina NextSeq 500 (Homo sapiens);Illumina NovaSeq 6000 (Homo sapiens) |
|
GSE68028
|
MeDIP-chip |
1 |
NimbleGen Human DNA Methylation 2.1M Deluxe Promoter Array [100929_HG19_Deluxe_Prom_Meth_HX1] |
|
C GSE100376
|
ATAC-seq |
24 |
Illumina NextSeq 500 (Homo sapiens) |
|
GSE167211
|
RNA-seq |
1 |
Illumina HiSeq 2000 (Homo sapiens) |
|
GSE165132
|
RNA-seq |
56 |
NextSeq 550 (Homo sapiens) |
|
C GSE100266
|
ATAC-seq;Chip-seq;RNA-seq |
32 |
Illumina HiSeq 2500 (Homo sapiens) |
|
C GSE165703
|
ATAC-seq |
82 |
Illumina HiSeq 4000 (Homo sapiens) |
|
GSE246082
|
RNA-seq |
6 |
Illumina HiSeq 4000 (Homo sapiens) |
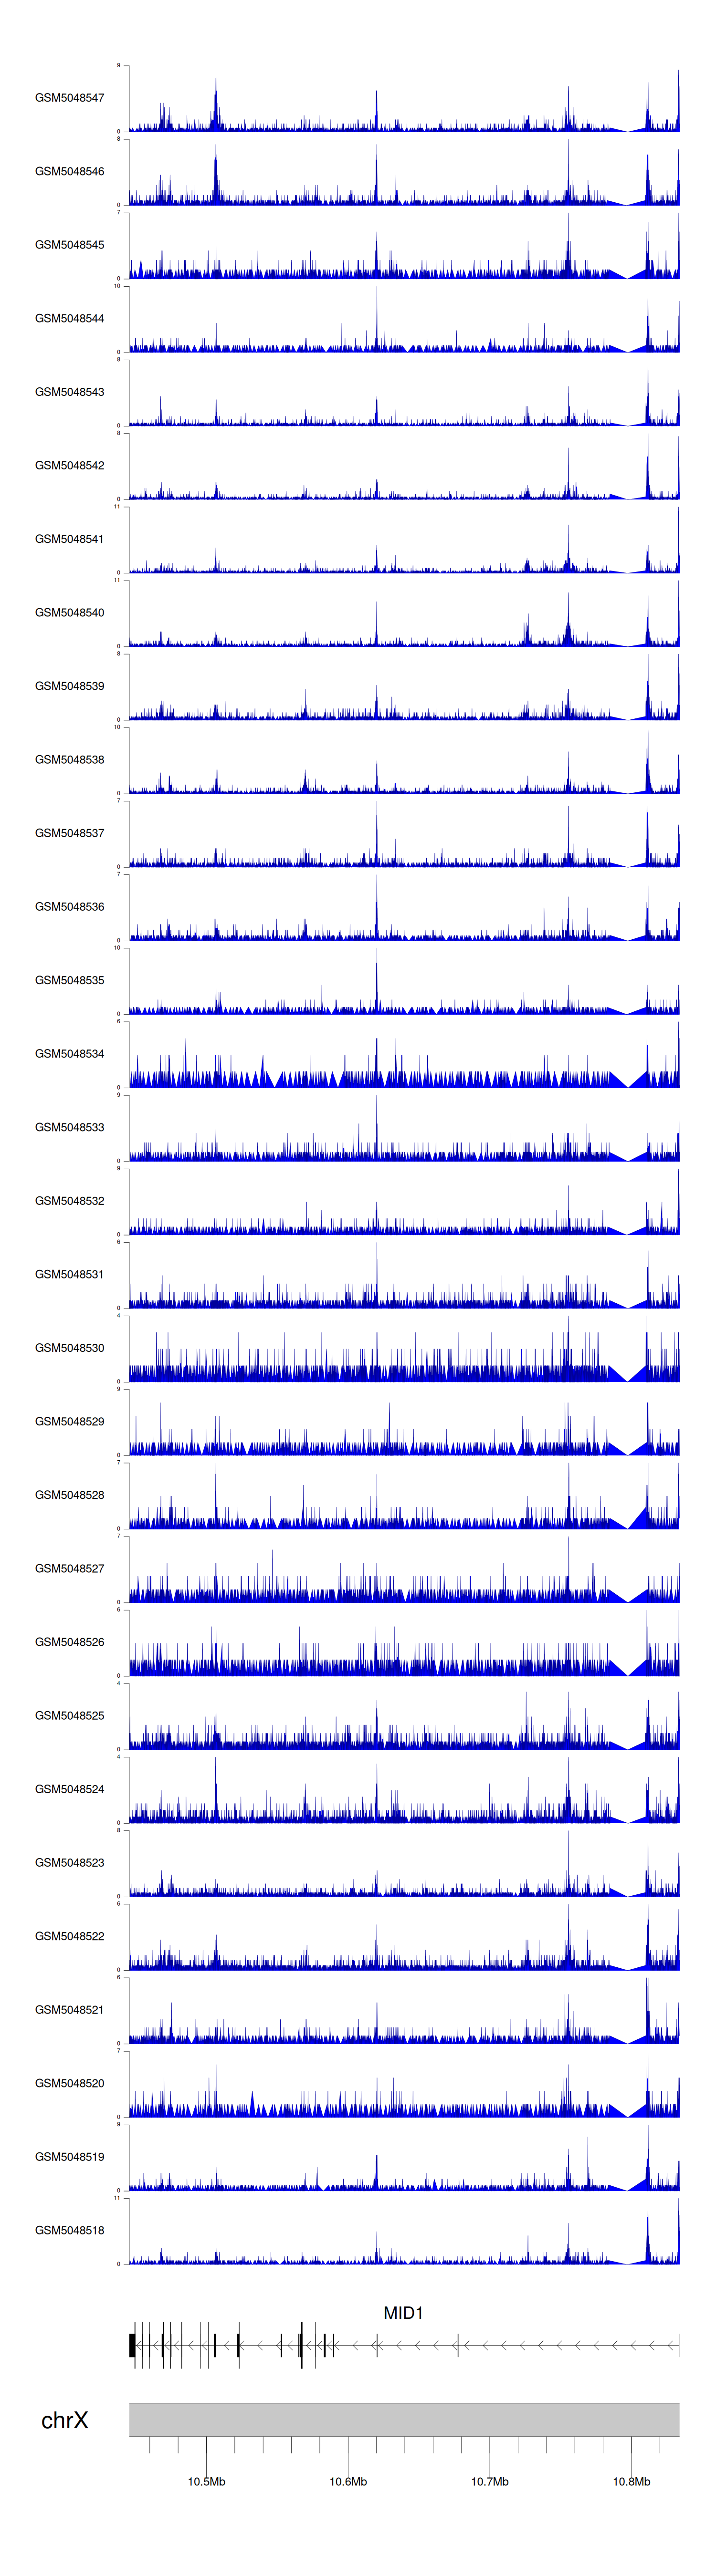
When the gene can detect a peak in the dataset, a peak plot will be displayed.
> Dataset: GSE165705 - MID1 peak across samples
|
Peak Plot
|
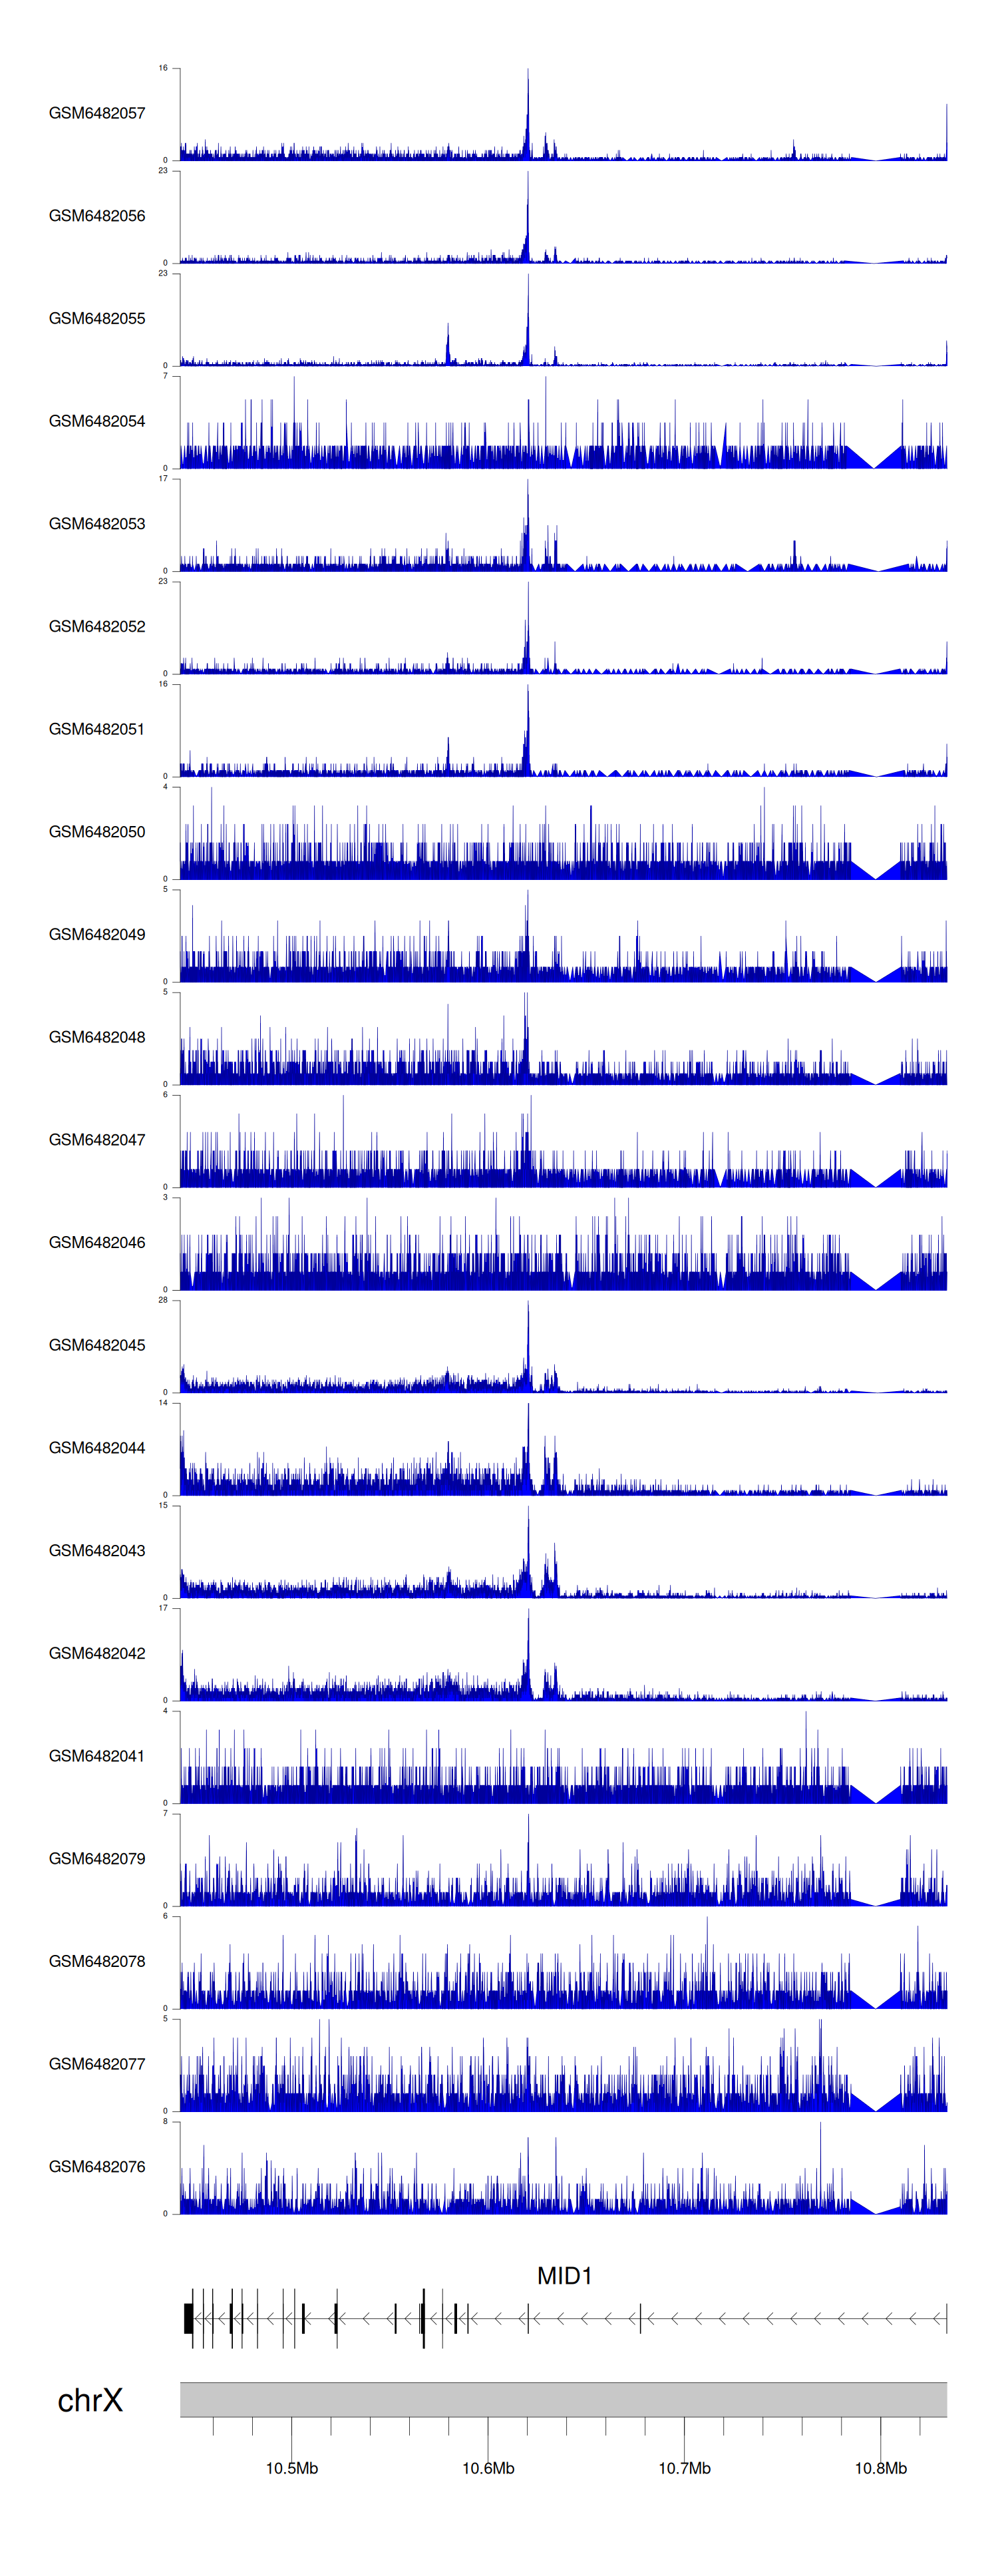
> Dataset: GSE144329 - MID1 peak across samples
|
Peak Plot

|
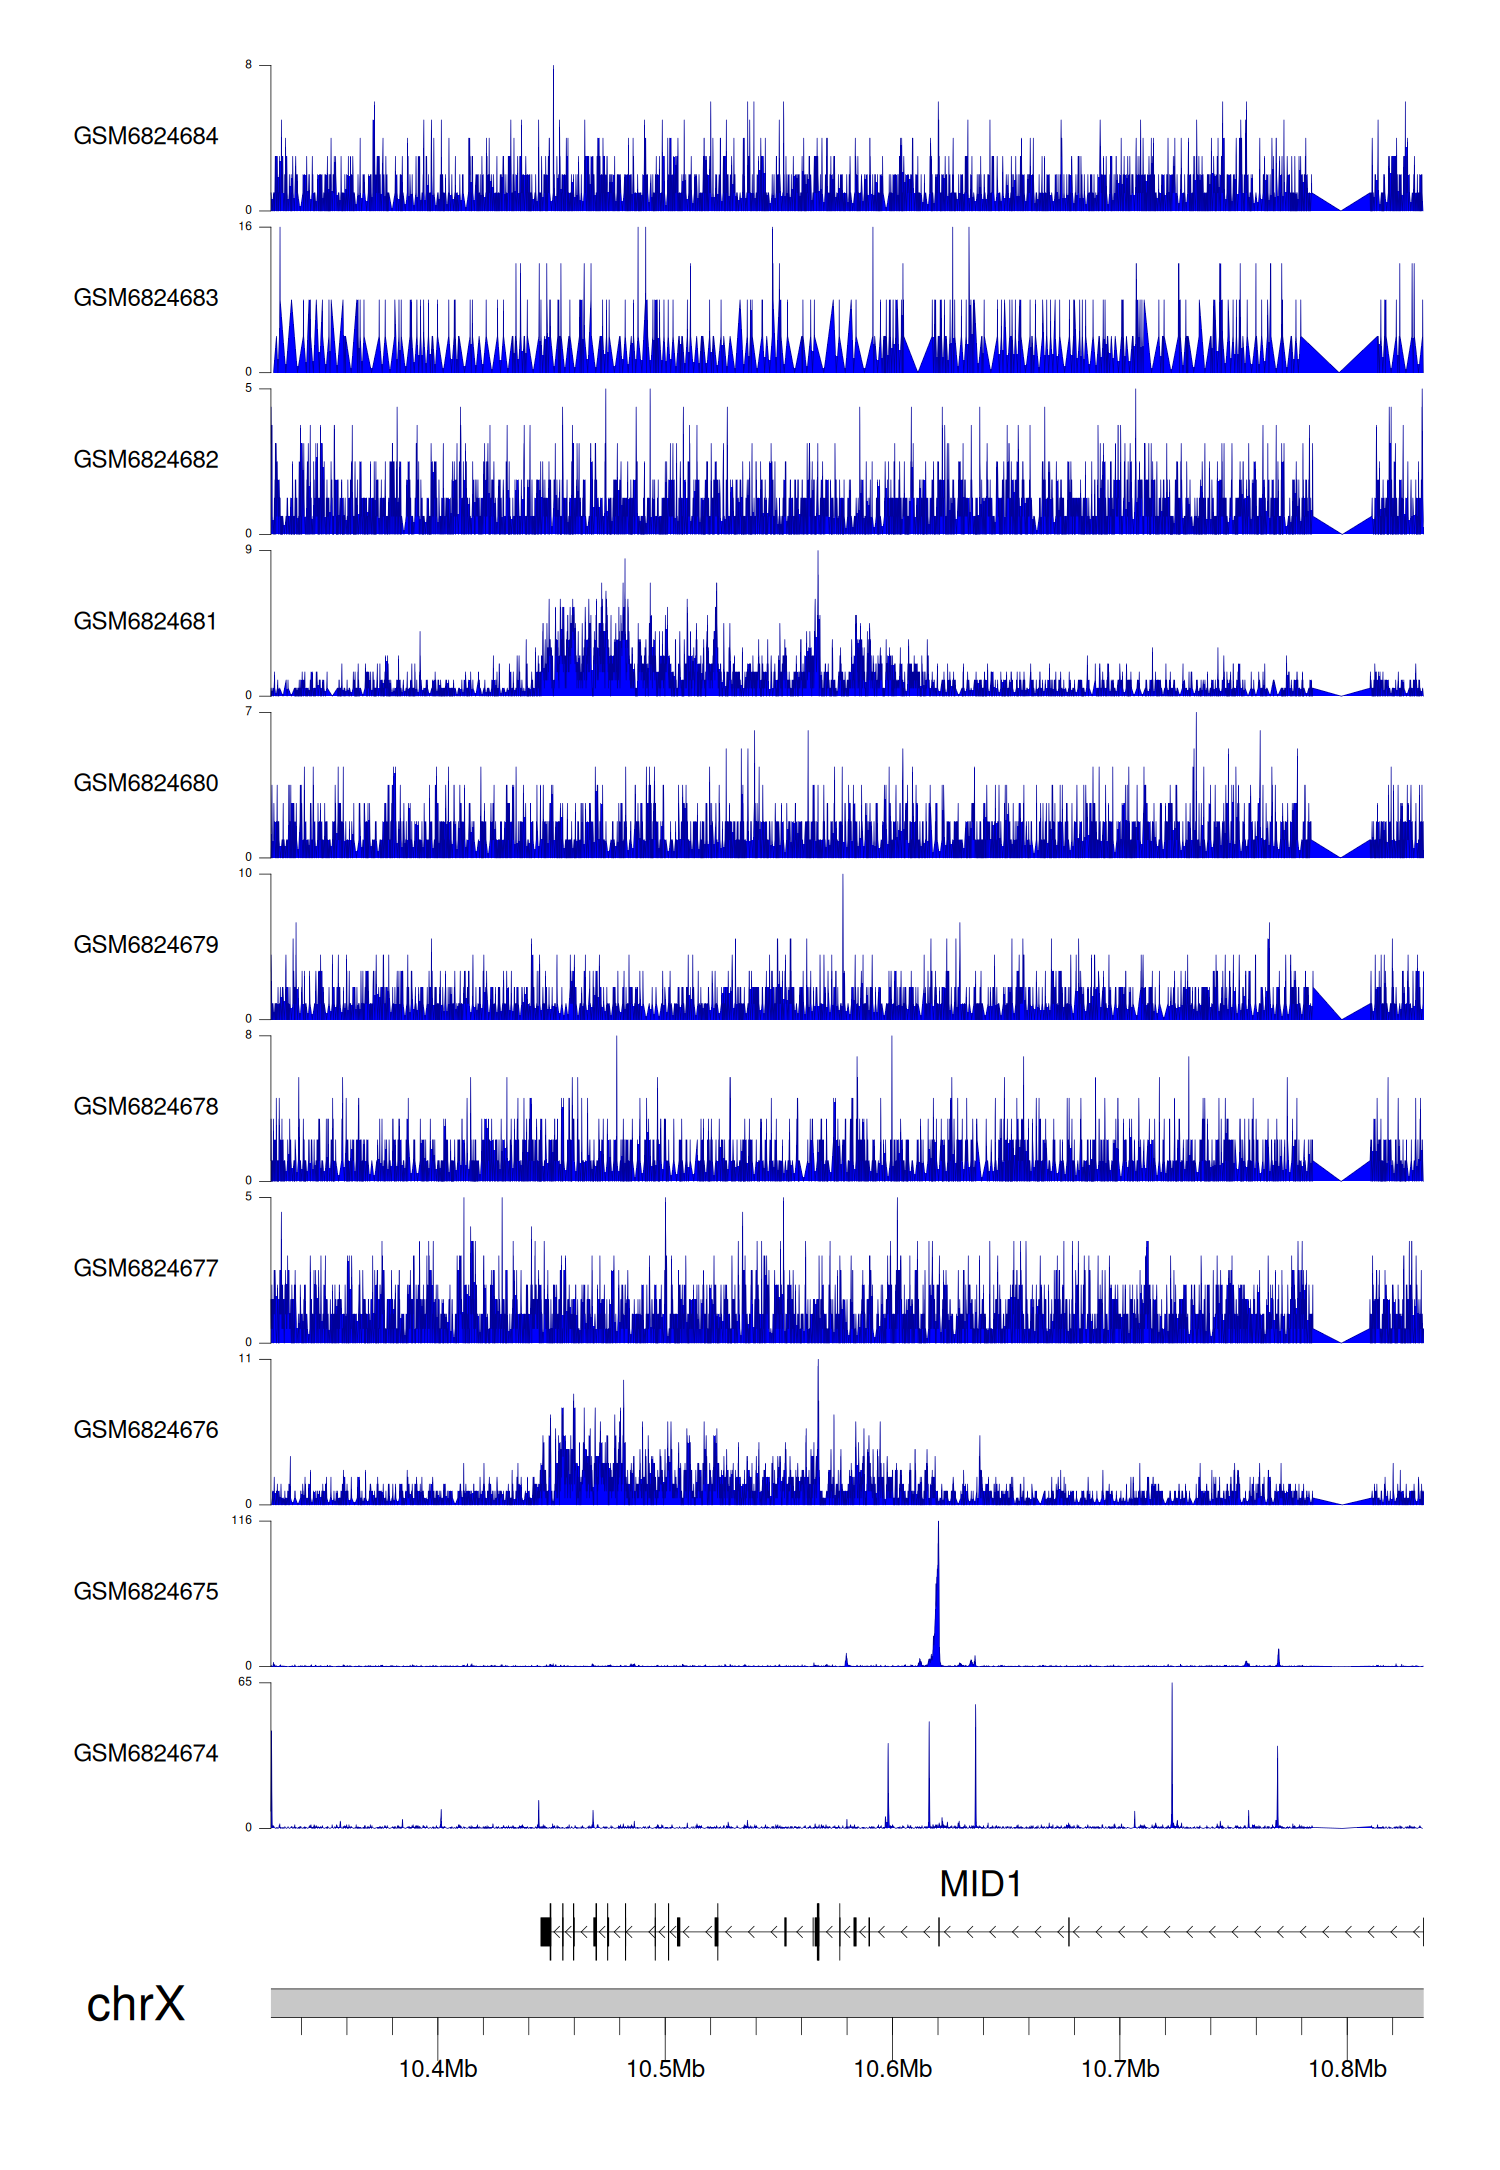
> Dataset: GSE220859 - MID1 peak across samples
|
Peak Plot
|
> Dataset: GSE211651 - MID1 peak across samples
|
Peak Plot
|
> Dataset: GSE100376 - MID1 peak across samples
|
Peak Plot
|
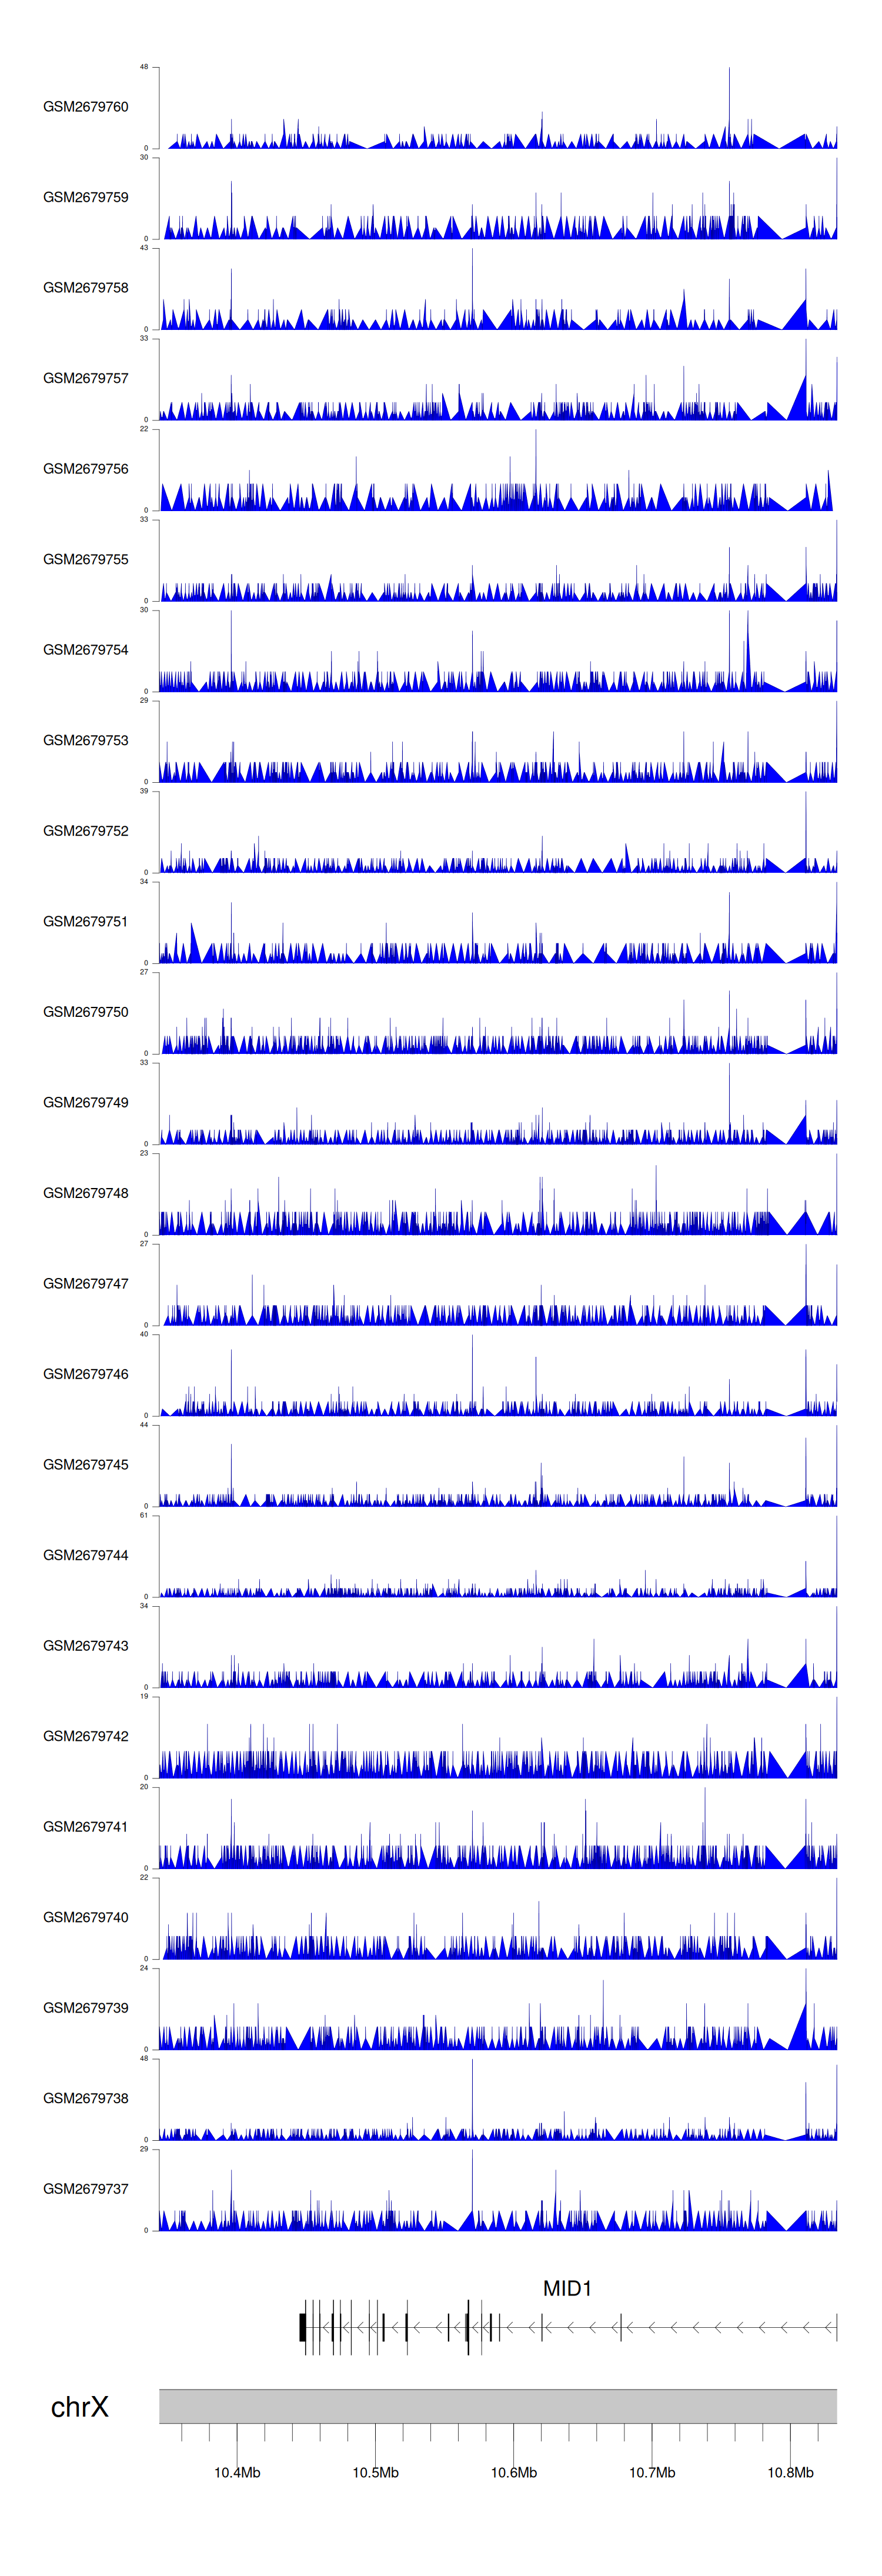
> Dataset: GSE100266 - MID1 peak across samples
|
Peak Plot
|
> Dataset: GSE165703 - MID1 peak across samples
|
Peak Plot
|
|
|
