| Accession |
GSE99737
|
| Status |
2018/6/10 |
| Title |
Platelet Transcriptome Profiling in HIV and ABCC4 as a Biomarker of Platelet Activity |
| Organism |
Homo sapiens |
| Experiment type |
Expression profiling by high throughput sequencing |
| Summary |
The purpose of this study was to perform an unbiased RNA expression profile in platelets from HIV subjects under ART and healthy controls to identify a gene signature for the HIV hyperactive phenotype.
Methods: Rna-Sequencing was performed in leukocyte-depleted platelet RNA from 6 HIV subjects and 3 healthy controls. qRT–PCR validation was performed to validate our candidate transcripts.
Results: Across the 9 platelet samples, there was an average of 28.3 million mapped reads per sample with an average unique mapping rate of 91.6 %. Using a cut-off of normalized counts ≥1 across the 9 samples, we found 11988 expressed transcripts.
Conclusions: Our study represents a detailed analysis of platelet transcriptome generated by RNA-seq technology in HIV patients under ART. Further experiments identified the mechanism of our transcript target in mediating platelet activity and platelet cell effector function. |
| Samples |
| GSM ID |
Sample info |
Characteristics |
Description |
|
GSM2651094
|
THR68.1 |
disease state:healthy; molecule:platelet RNA |
- |
|
GSM2651095
|
HIV12.1 |
disease state:HIV; molecule:platelet RNA |
- |
|
GSM2651096
|
HIV04.1 |
disease state:HIV; molecule:platelet RNA |
- |
|
GSM2651097
|
THR66.1 |
disease state:healthy; molecule:platelet RNA |
- |
|
GSM2651098
|
HIV03.1 |
disease state:HIV; molecule:platelet RNA |
- |
|
GSM2651099
|
HIV10.1 |
disease state:HIV; molecule:platelet RNA |
- |
|
GSM2651100
|
THR67.1 |
disease state:healthy; molecule:platelet RNA |
- |
|
GSM2651101
|
HIV17.1 |
disease state:HIV; molecule:platelet RNA |
- |
|
GSM2651102
|
HIV15.1 |
disease state:HIV; molecule:platelet RNA |
- |
|
| Platform |
GPL16791 : Illumina HiSeq 2500 (Homo sapiens) |
| Literature |
30062189 |
| Download |
Download xCell Data Download Expression Analysis Data
|
|
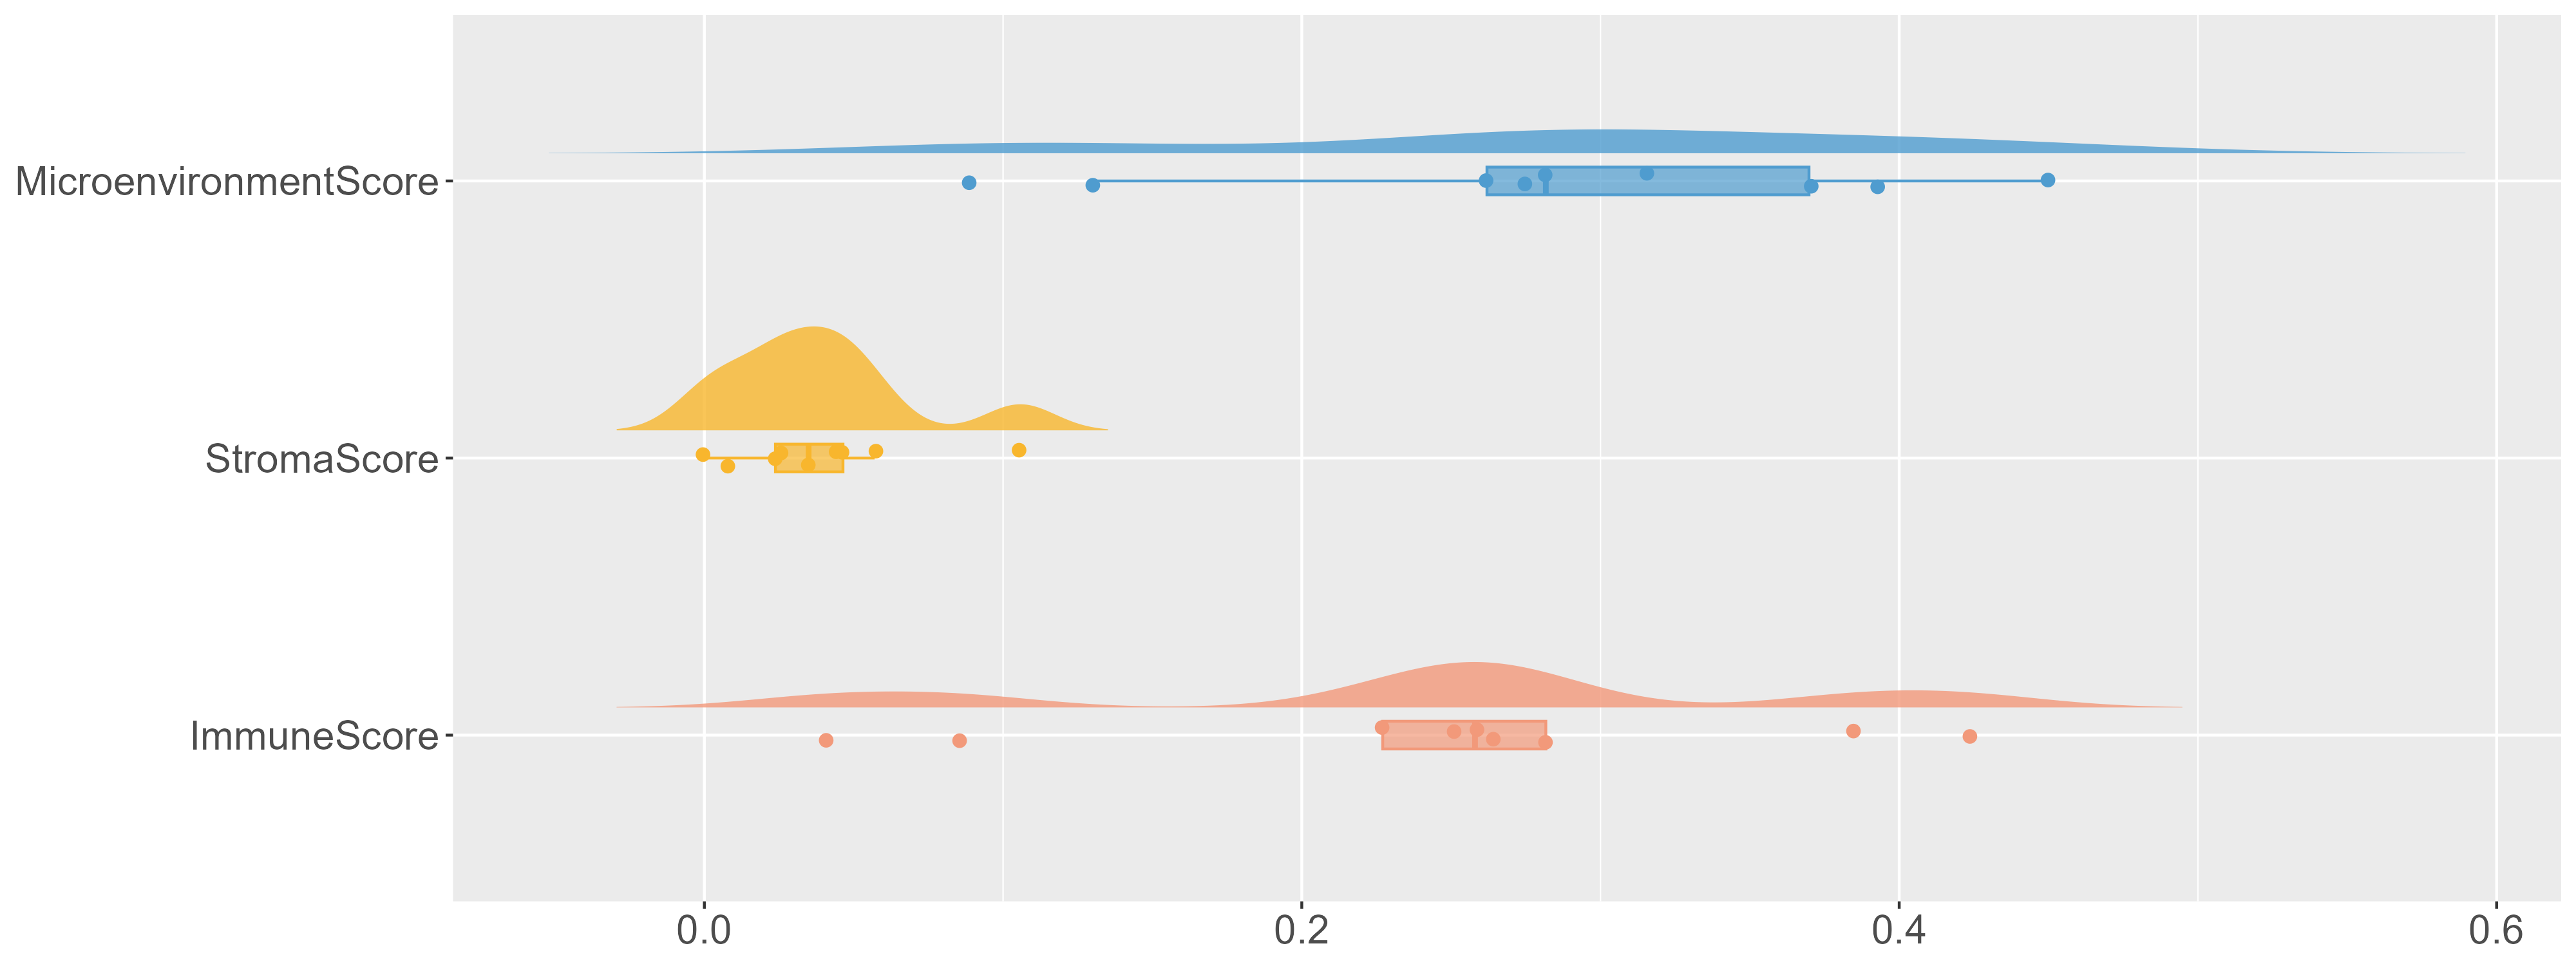
xCell Plot
|
|
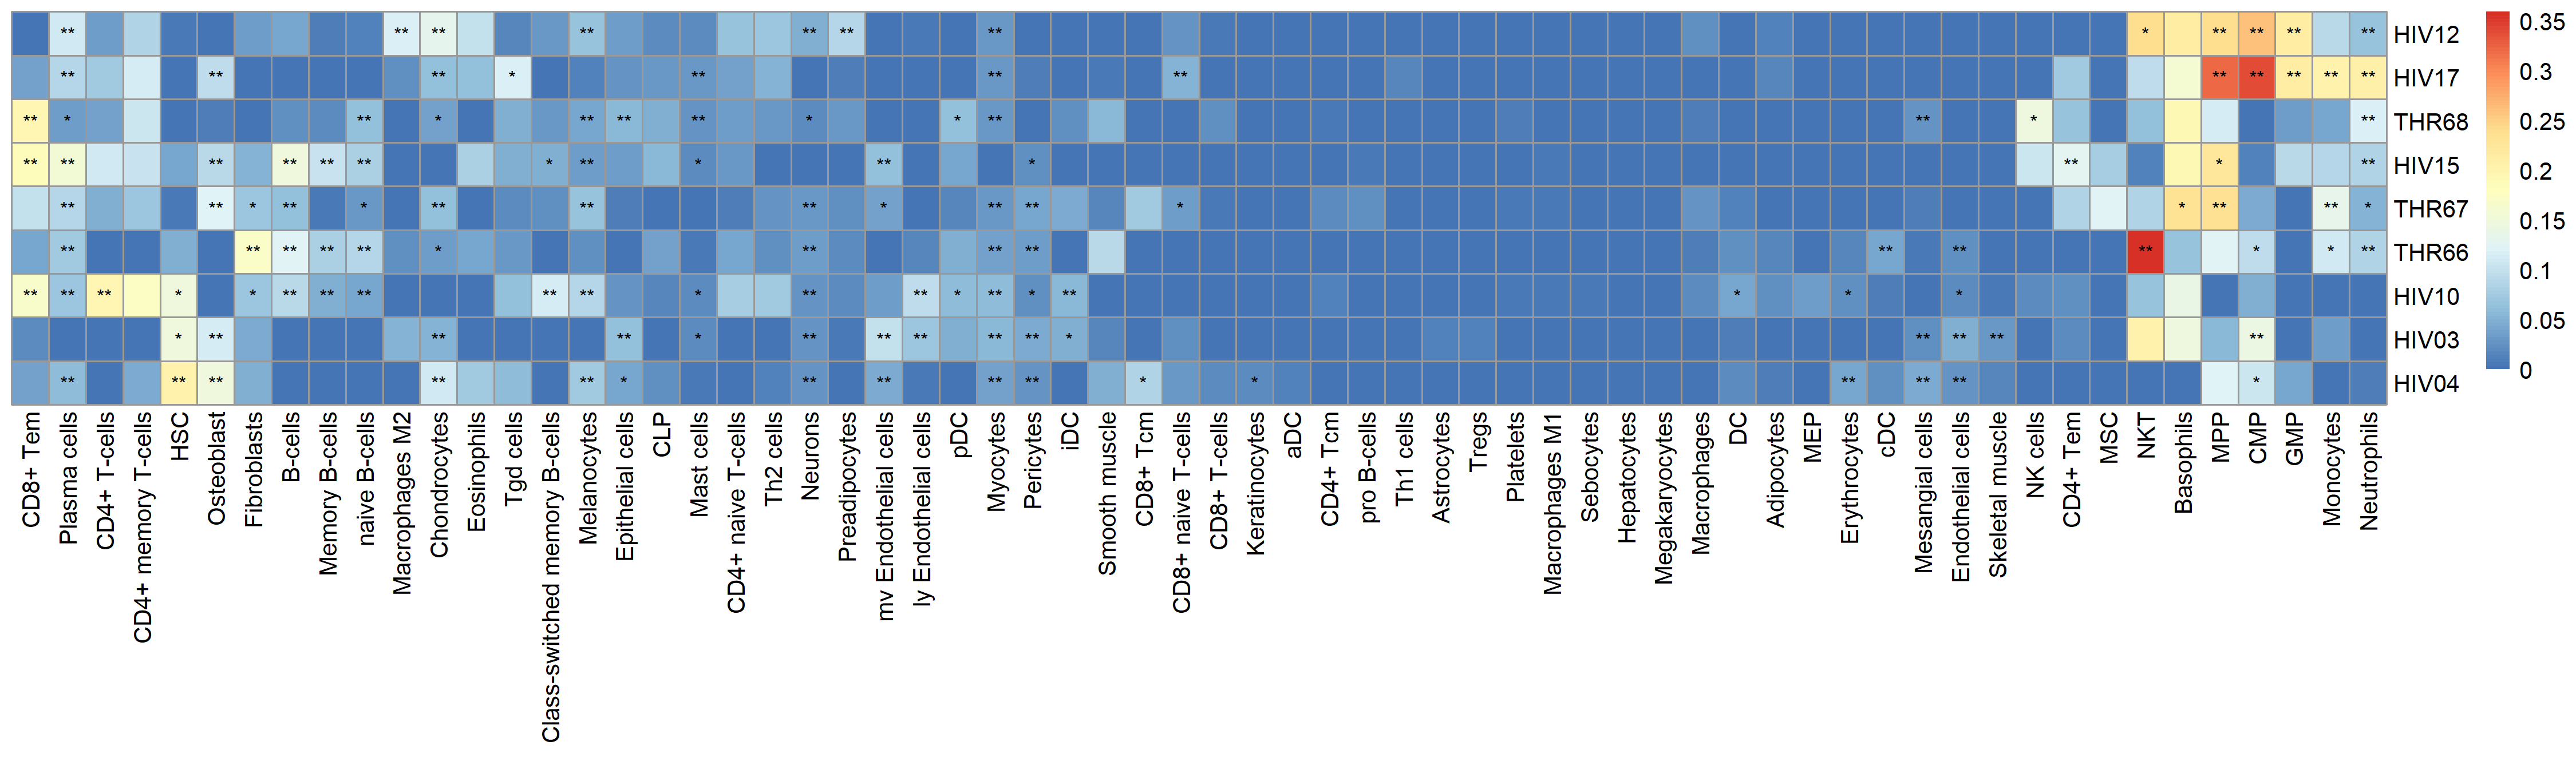 * p<0.05 ** p<0.01
|
 Virus Dataset Detail
