Gene Information
|
Gene Name
|
PTPRF |
|
Gene ID
|
5792
|
|
Gene Full Name
|
protein tyrosine phosphatase receptor type F |
|
Gene Alias
|
BNAH2|LAR |
|
Transcripts
|
ENSG00000142949
|
|
Virus
|
HIV |
|
Gene Type
|
protein-coding |
|
HPA Location Info
|
Golgi apparatus;Intracellular and membrane; 
|
|
Membrane Info
|
Disease related genes, Enzymes, Plasma proteins, Potential drug targets, Predicted intracellular proteins, Predicted membrane proteins |
|
Uniport_ID
|
P10586
|
|
HGNC ID
|
HGNC:9670
|
|
OMIM ID
|
179590 |
|
Summary
|
The protein encoded by this gene is a member of the protein tyrosine phosphatase (PTP) family. PTPs are known to be signaling molecules that regulate a variety of cellular processes including cell growth, differentiation, mitotic cycle, and oncogenic transformation. This PTP possesses an extracellular region, a single transmembrane region, and two tandem intracytoplasmic catalytic domains, and thus represents a receptor-type PTP. The extracellular region contains three Ig-like domains, and nine non-Ig like domains similar to that of neural-cell adhesion molecule. This PTP was shown to function in the regulation of epithelial cell-cell contacts at adherents junctions, as well as in the control of beta-catenin signaling. An increased expression level of this protein was found in the insulin-responsive tissue of obese, insulin-resistant individuals, and may contribute to the pathogenesis of insulin resistance. Two alternatively spliced transcript variants of this gene, which encode distinct proteins, have been reported. [provided by RefSeq, Jul 2008] |
Target gene [PTPRF] related to VISs 
Integration Table: if previous studies reported that target gene was altered by virus integration events, the overlap between VISs in this literature and Cistrome factors was listed in this section
| DVID |
Chromosome |
HM |
TFBS |
CA |
Sum of Overlapped Records |
Detail |
| 4006293 |
chr1 |
21 |
5 |
0 |
26 |
View |
Target gene [PTPRF] related to Omics data
| Data ID |
Experiment type |
Sample number |
Platform |
|
GSE99737
|
RNA-seq |
9 |
Illumina HiSeq 2500 (Homo sapiens) |
|
GSE144332
|
RNA-seq |
75 |
NextSeq 550 (Homo sapiens) |
|
C GSE165705
|
Chip-seq |
30 |
Illumina NovaSeq 6000 (Homo sapiens) |
|
GSE164264
|
RNA-seq |
6 |
BGISEQ-500 (Homo sapiens) |
|
GSE262621
|
RNA-seq |
70 |
Illumina NovaSeq 6000 (Homo sapiens) |
|
GSE128121
|
RNA-seq |
16 |
Illumina HiSeq 4000 (Homo sapiens) |
|
GSE162914
|
RNA-seq |
211 |
Illumina HiSeq 2500 (Homo sapiens) |
|
GSE279982
|
Methylation profiling (Array) |
576 |
Infinium MethylationEPIC |
|
C GSE144329
|
ATAC-seq |
96 |
NextSeq 550 (Homo sapiens) |
|
GSE205204
|
RNA-seq |
14 |
Illumina NovaSeq 6000 (Homo sapiens) |
|
GSE125686
|
RNA-seq |
62 |
Illumina HiSeq 2000 (Homo sapiens);Illumina HiSeq 2500 (Homo sapiens);Illumina NextSeq 500 (Homo sapiens) |
|
C GSE220859
|
Chip-seq |
11 |
Illumina NovaSeq 6000 (Homo sapiens) |
|
GSE165708
|
RNA-seq |
100 |
Illumina HiSeq 4000 (Homo sapiens) |
|
C GSE211651
|
Chip-seq;RNA-seq;PRO-seq |
39 |
Illumina NextSeq 500 (Homo sapiens);Illumina NovaSeq 6000 (Homo sapiens) |
|
GSE68028
|
MeDIP-chip |
1 |
NimbleGen Human DNA Methylation 2.1M Deluxe Promoter Array [100929_HG19_Deluxe_Prom_Meth_HX1] |
|
C GSE100376
|
ATAC-seq |
24 |
Illumina NextSeq 500 (Homo sapiens) |
|
GSE167211
|
RNA-seq |
1 |
Illumina HiSeq 2000 (Homo sapiens) |
|
GSE165132
|
RNA-seq |
56 |
NextSeq 550 (Homo sapiens) |
|
C GSE100266
|
ATAC-seq;Chip-seq;RNA-seq |
32 |
Illumina HiSeq 2500 (Homo sapiens) |
|
C GSE165703
|
ATAC-seq |
82 |
Illumina HiSeq 4000 (Homo sapiens) |
|
GSE246082
|
RNA-seq |
6 |
Illumina HiSeq 4000 (Homo sapiens) |
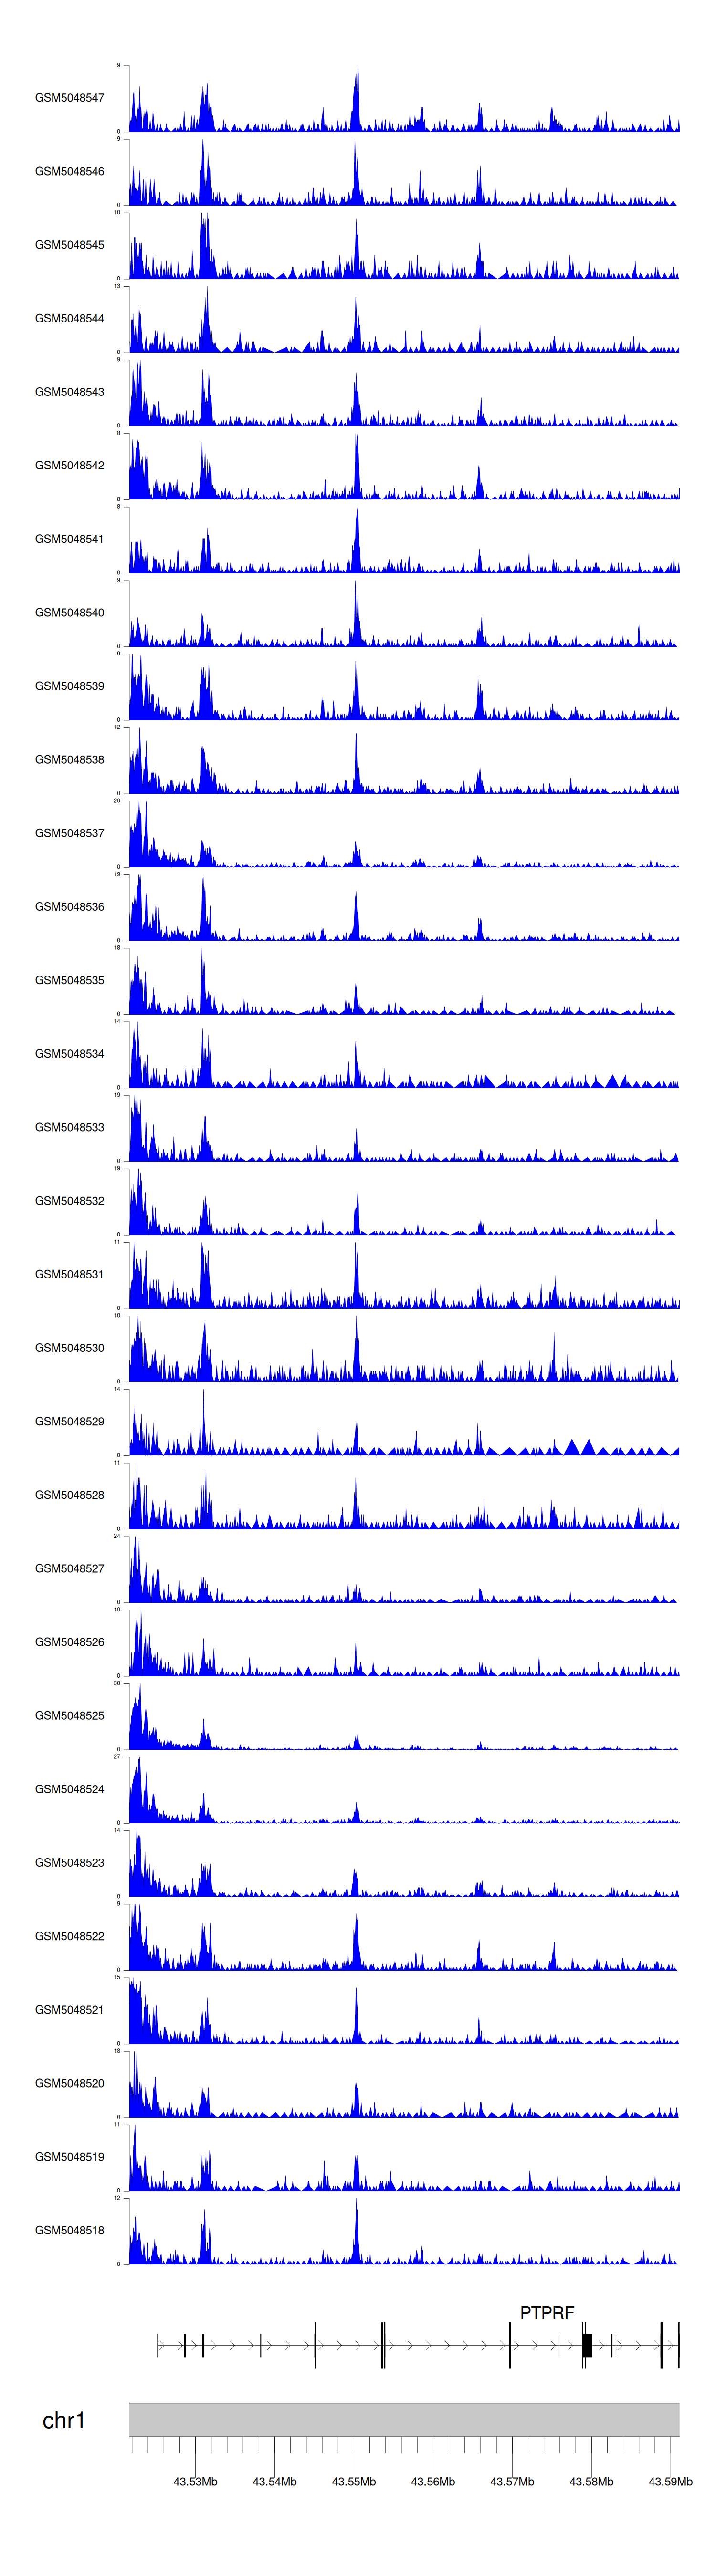
When the gene can detect a peak in the dataset, a peak plot will be displayed.
> Dataset: GSE165705 - PTPRF peak across samples
|
Peak Plot
|
> Dataset: GSE144329 - PTPRF peak across samples
|
Peak Plot

|
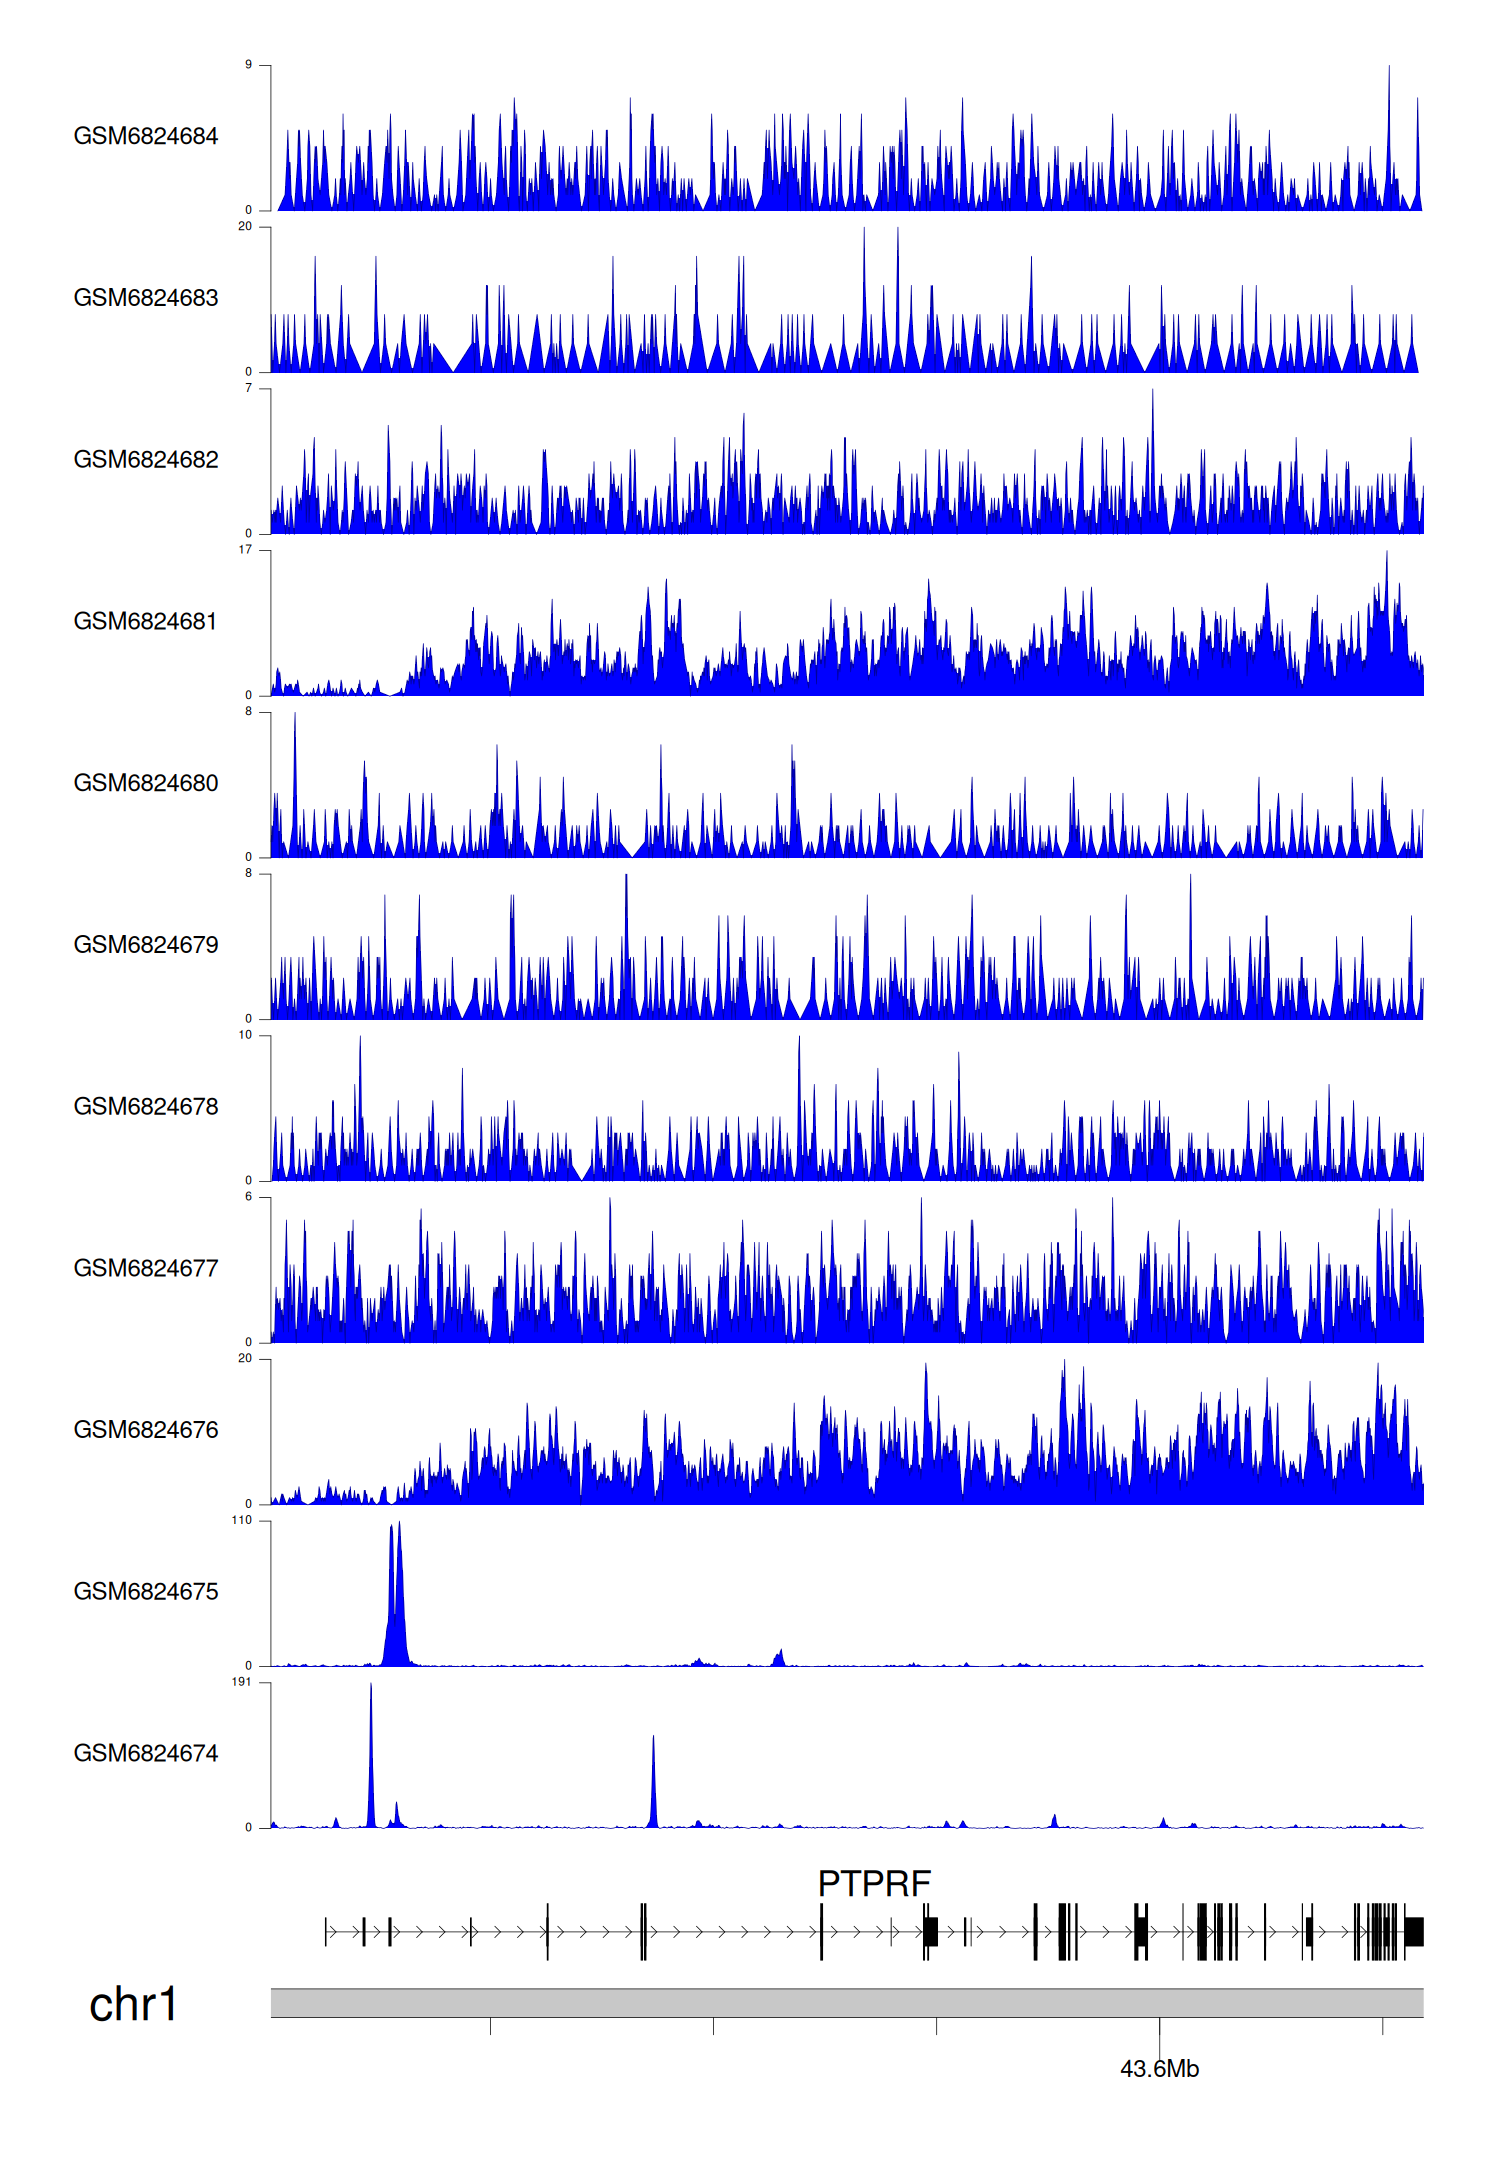
> Dataset: GSE220859 - PTPRF peak across samples
|
Peak Plot
|
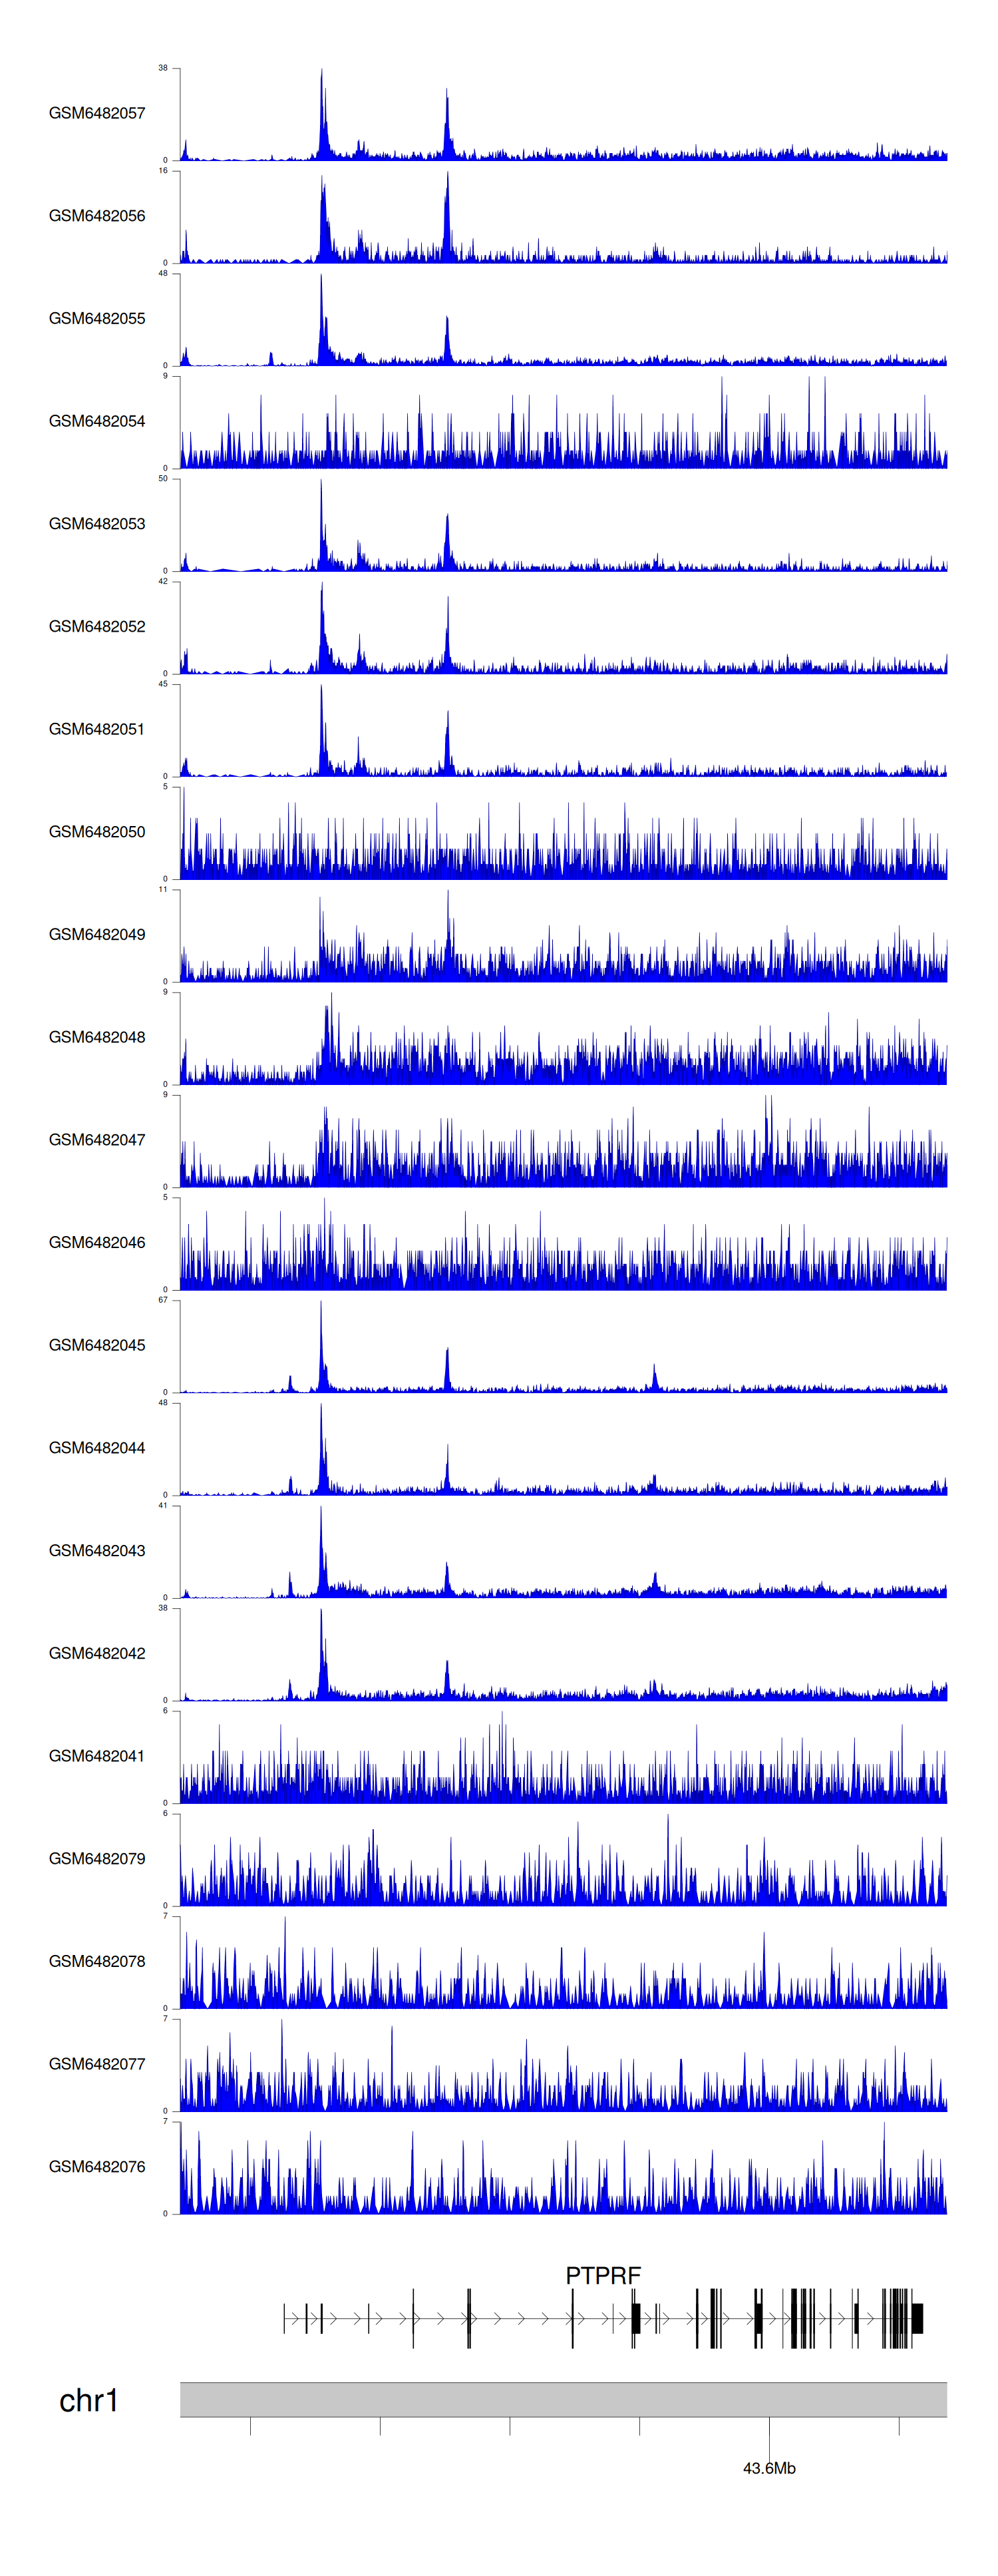
> Dataset: GSE211651 - PTPRF peak across samples
|
Peak Plot
|
> Dataset: GSE100376 - PTPRF peak across samples
|
Peak Plot
|
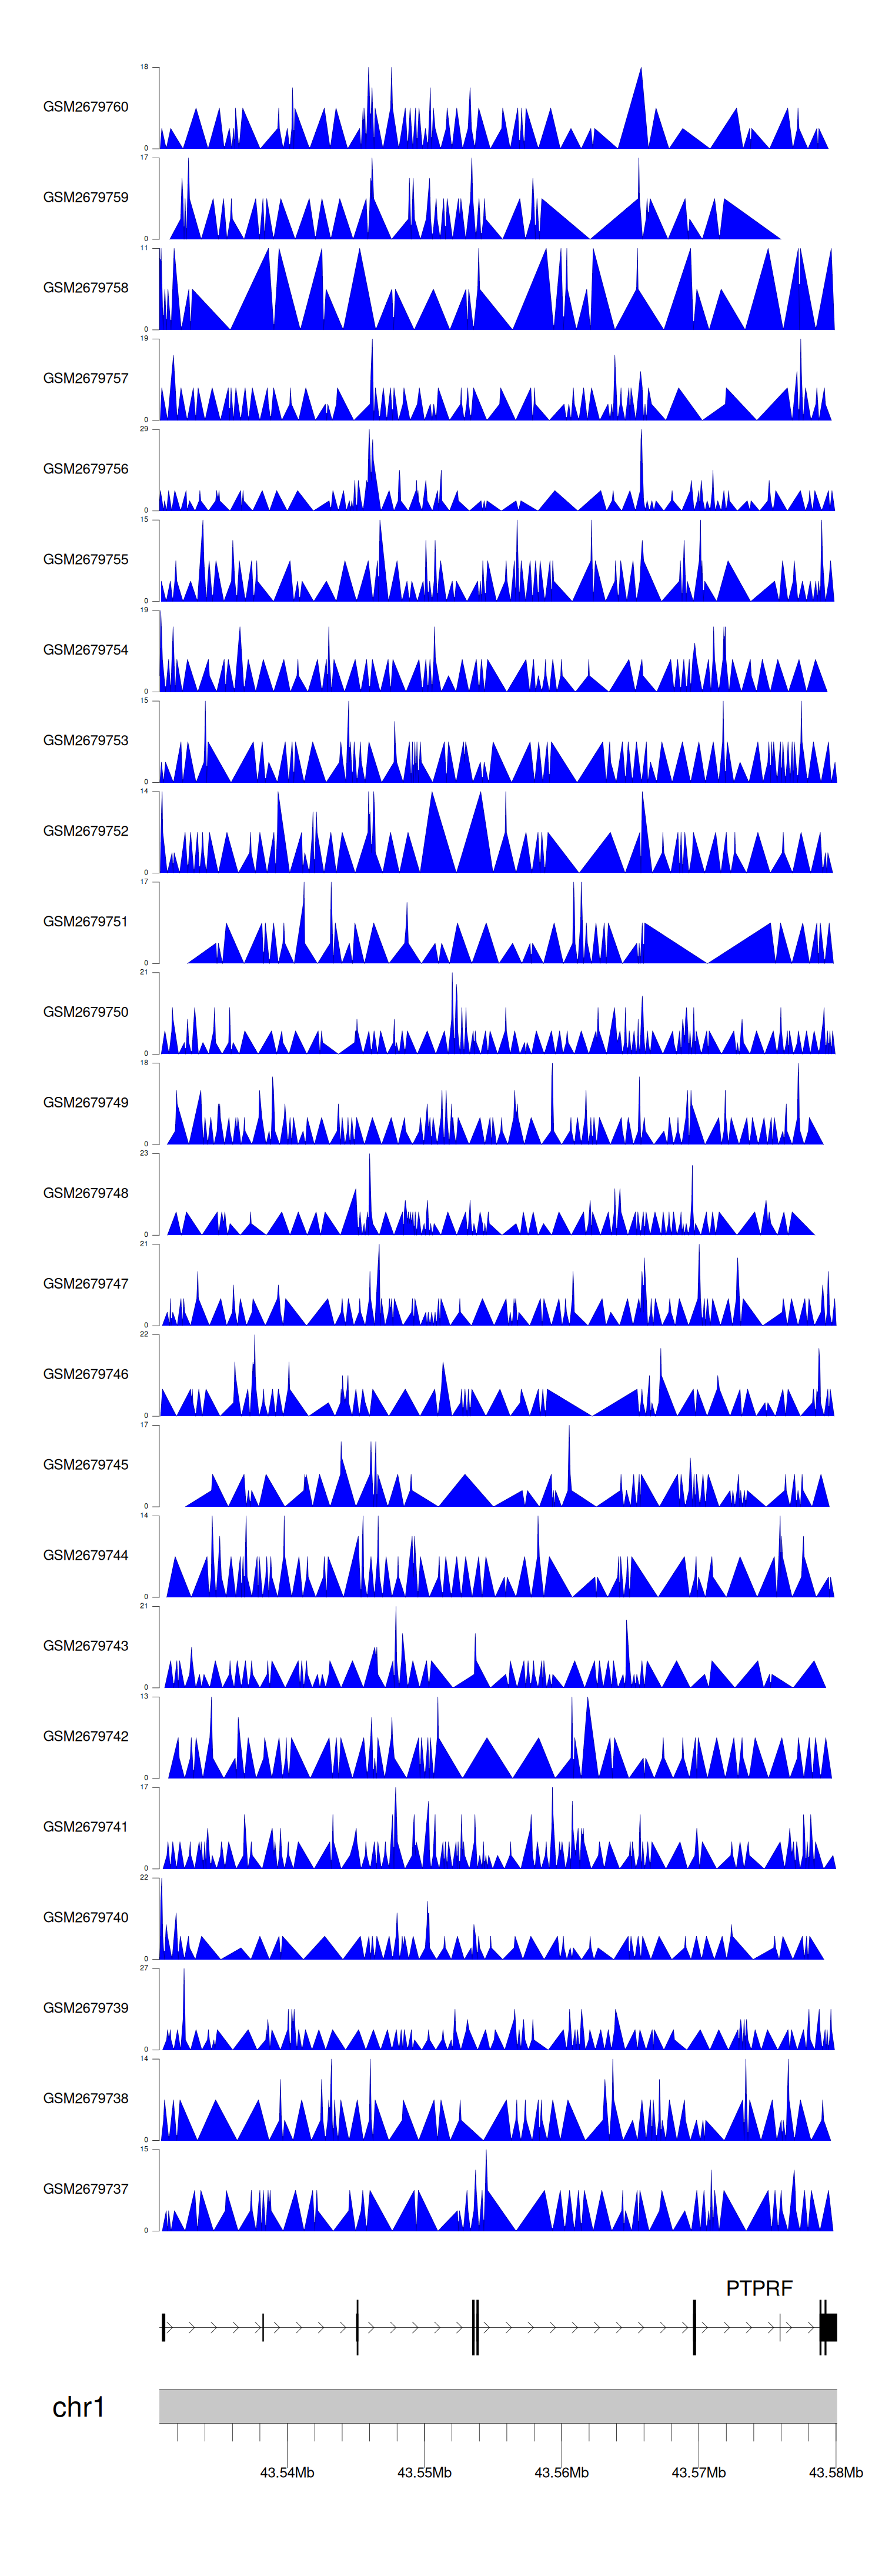
> Dataset: GSE100266 - PTPRF peak across samples
|
Peak Plot
|
> Dataset: GSE165703 - PTPRF peak across samples
|
Peak Plot
|
|
|
