Gene Information
|
Gene Name
|
FGFR1 |
|
Gene ID
|
2260
|
|
Gene Full Name
|
fibroblast growth factor receptor 1 |
|
Gene Alias
|
BFGFR|CD331|CEK|ECCL|FGFBR|FGFR-1|FLG|FLT-2|FLT2|HBGFR|HH2|HRTFDS|KAL2|N-SAM|OGD|bFGF-R-1 |
|
Transcripts
|
ENSG00000077782
|
|
Virus
|
HIV |
|
Gene Type
|
protein-coding |
|
HPA Location Info
|
Microtubules, Cytokinetic bridge, Mitotic spindle;Primary cilium, Centriolar satellite, Basal body, Cytosol; 
|
|
Membrane Info
|
Cancer-related genes, CD markers, Disease related genes, Enzymes, FDA approved drug targets, Human disease related genes, Plasma proteins, Predicted intracellular proteins, Predicted membrane proteins, RAS pathway related proteins, Transporters |
|
Uniport_ID
|
P11362
|
|
HGNC ID
|
HGNC:3688
|
|
OMIM ID
|
136350 |
|
Summary
|
The protein encoded by this gene is a member of the fibroblast growth factor receptor (FGFR) family, where amino acid sequence is highly conserved between members and throughout evolution. FGFR family members differ from one another in their ligand affinities and tissue distribution. A full-length representative protein consists of an extracellular region, composed of three immunoglobulin-like domains, a single hydrophobic membrane-spanning segment and a cytoplasmic tyrosine kinase domain. The extracellular portion of the protein interacts with fibroblast growth factors, setting in motion a cascade of downstream signals, ultimately influencing mitogenesis and differentiation. This particular family member binds both acidic and basic fibroblast growth factors and is involved in limb induction. Mutations in this gene have been associated with Pfeiffer syndrome, Jackson-Weiss syndrome, Antley-Bixler syndrome, osteoglophonic dysplasia, and autosomal dominant Kallmann syndrome 2. Chromosomal aberrations involving this gene are associated with stem cell myeloproliferative disorder and stem cell leukemia lymphoma syndrome. Alternatively spliced variants which encode different protein isoforms have been described; however, not all variants have been fully characterized. [provided by RefSeq, Jul 2008] |
Target gene [FGFR1] related to VISs 
Integration Table: if previous studies reported that target gene was altered by virus integration events, the overlap between VISs in this literature and Cistrome factors was listed in this section
| DVID |
Chromosome |
HM |
TFBS |
CA |
Sum of Overlapped Records |
Detail |
| 4000389 |
chr8 |
39 |
198 |
259 |
496 |
View |
Target gene [FGFR1] related to Omics data
| Data ID |
Experiment type |
Sample number |
Platform |
|
C GSE221688
|
Chip-seq;scATAC-Seq;scRNA-Seq |
12 |
Illumina NovaSeq 6000 (Homo sapiens) |
|
GSE99737
|
RNA-seq |
9 |
Illumina HiSeq 2500 (Homo sapiens) |
|
GSE144332
|
RNA-seq |
75 |
NextSeq 550 (Homo sapiens) |
|
C GSE165705
|
Chip-seq |
30 |
Illumina NovaSeq 6000 (Homo sapiens) |
|
GSE164264
|
RNA-seq |
6 |
BGISEQ-500 (Homo sapiens) |
|
GSE262621
|
RNA-seq |
70 |
Illumina NovaSeq 6000 (Homo sapiens) |
|
GSE128121
|
RNA-seq |
16 |
Illumina HiSeq 4000 (Homo sapiens) |
|
GSE162914
|
RNA-seq |
211 |
Illumina HiSeq 2500 (Homo sapiens) |
|
GSE279982
|
Methylation profiling (Array) |
576 |
Infinium MethylationEPIC |
|
C GSE144329
|
ATAC-seq |
96 |
NextSeq 550 (Homo sapiens) |
|
GSE205204
|
RNA-seq |
14 |
Illumina NovaSeq 6000 (Homo sapiens) |
|
GSE125686
|
RNA-seq |
62 |
Illumina HiSeq 2000 (Homo sapiens);Illumina HiSeq 2500 (Homo sapiens);Illumina NextSeq 500 (Homo sapiens) |
|
GSE198339
|
scRNA-seq |
8 |
Illumina NovaSeq 6000 (Homo sapiens) |
|
C GSE220859
|
Chip-seq |
11 |
Illumina NovaSeq 6000 (Homo sapiens) |
|
GSE165708
|
RNA-seq |
100 |
Illumina HiSeq 4000 (Homo sapiens) |
|
C GSE211651
|
Chip-seq;RNA-seq;PRO-seq |
39 |
Illumina NextSeq 500 (Homo sapiens);Illumina NovaSeq 6000 (Homo sapiens) |
|
GSE198809
|
scRNA-seq |
46 |
Illumina NovaSeq 6000 (Homo sapiens) |
|
GSE68028
|
MeDIP-chip |
1 |
NimbleGen Human DNA Methylation 2.1M Deluxe Promoter Array [100929_HG19_Deluxe_Prom_Meth_HX1] |
|
C GSE100376
|
ATAC-seq |
24 |
Illumina NextSeq 500 (Homo sapiens) |
|
GSE167211
|
RNA-seq |
1 |
Illumina HiSeq 2000 (Homo sapiens) |
|
GSE165132
|
RNA-seq |
56 |
NextSeq 550 (Homo sapiens) |
|
C GSE100266
|
ATAC-seq;Chip-seq;RNA-seq |
32 |
Illumina HiSeq 2500 (Homo sapiens) |
|
C GSE165703
|
ATAC-seq |
82 |
Illumina HiSeq 4000 (Homo sapiens) |
|
GSE246082
|
RNA-seq |
6 |
Illumina HiSeq 4000 (Homo sapiens) |
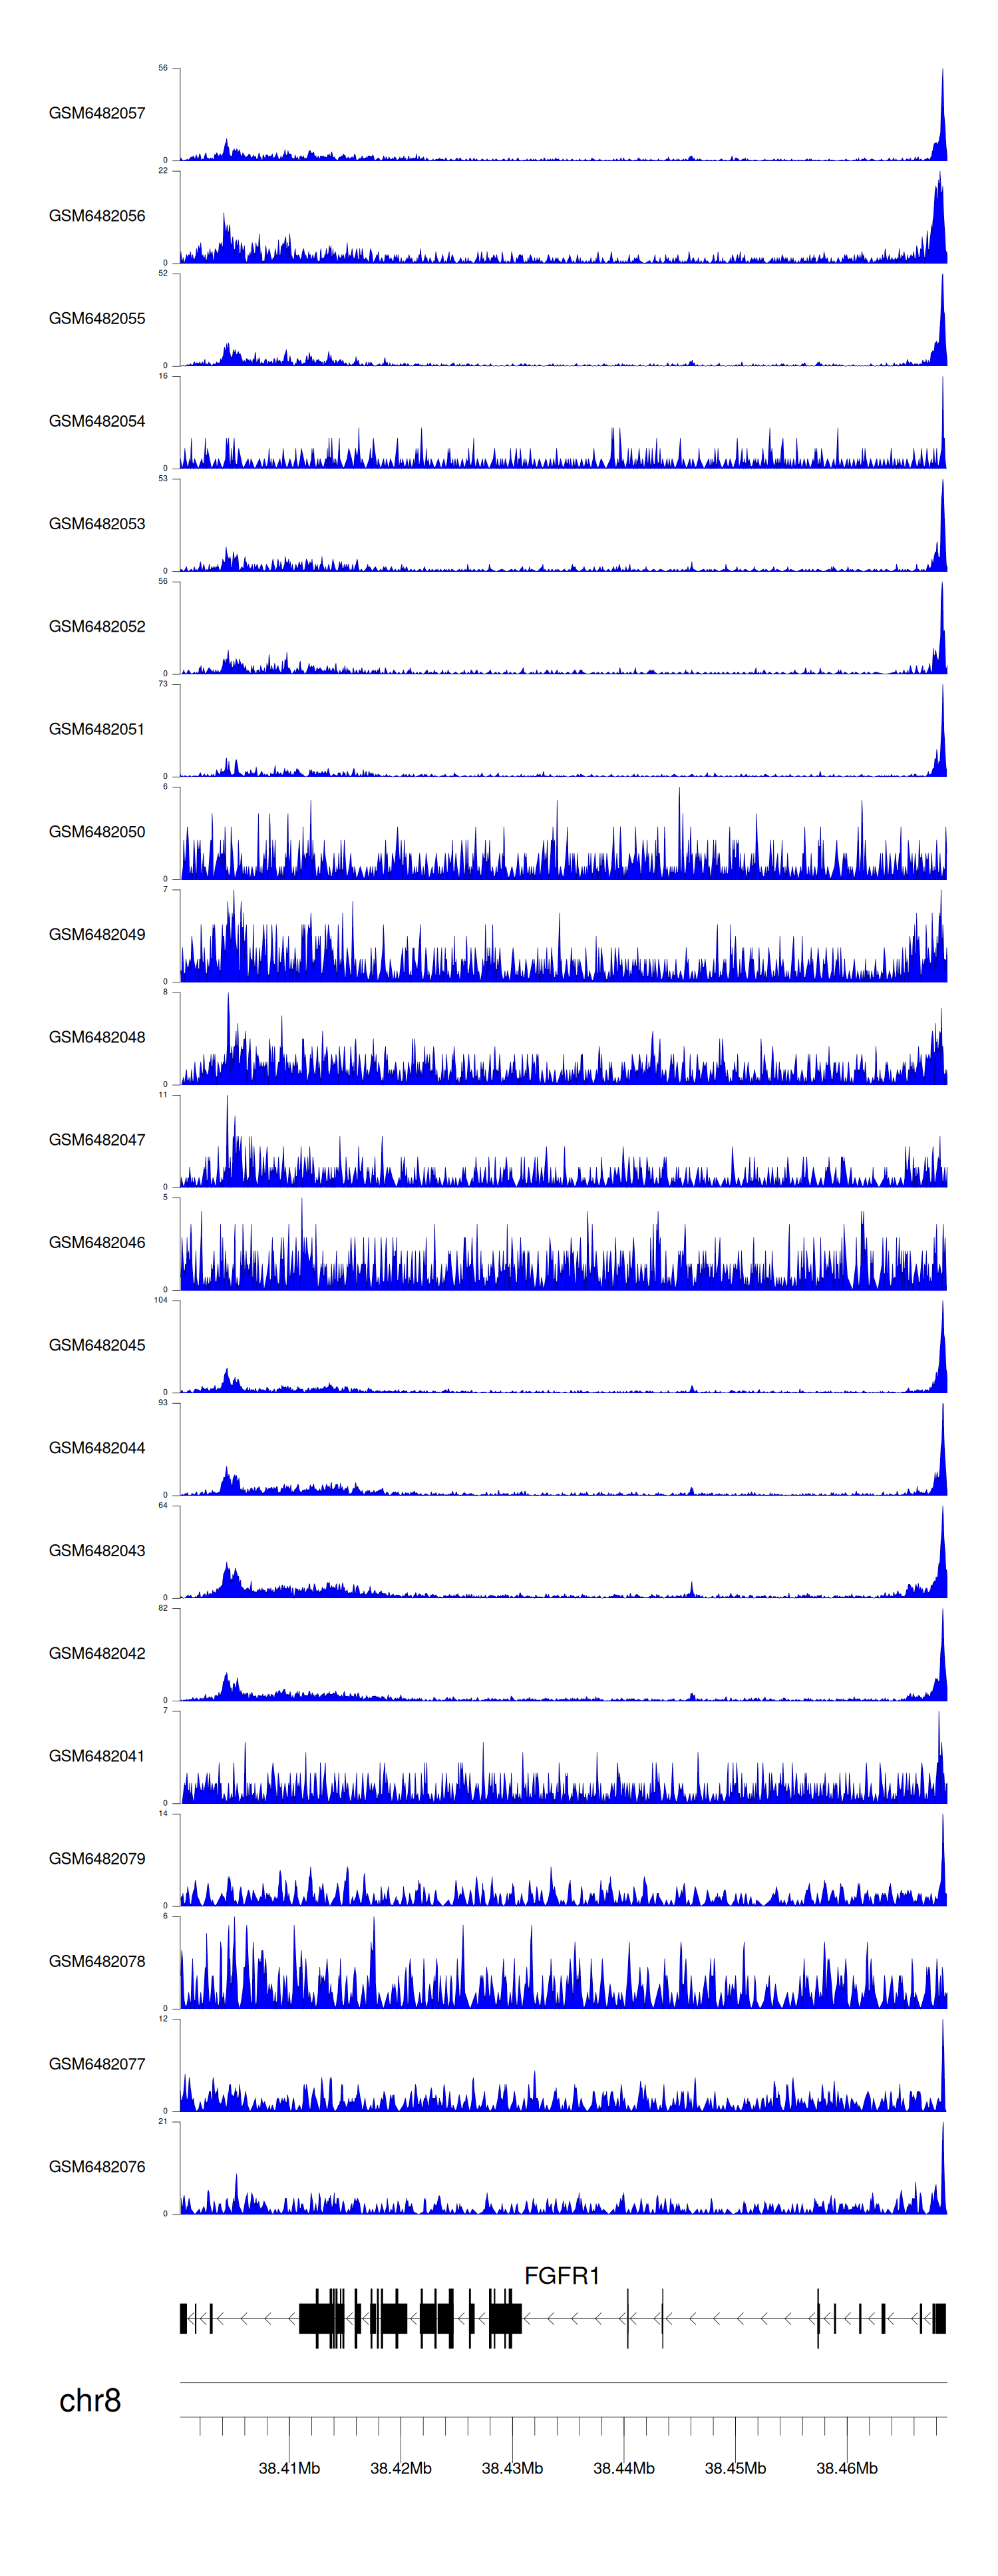
When the gene can detect a peak in the dataset, a peak plot will be displayed.
> Dataset: GSE221688 - FGFR1 peak across samples
|
Peak Plot
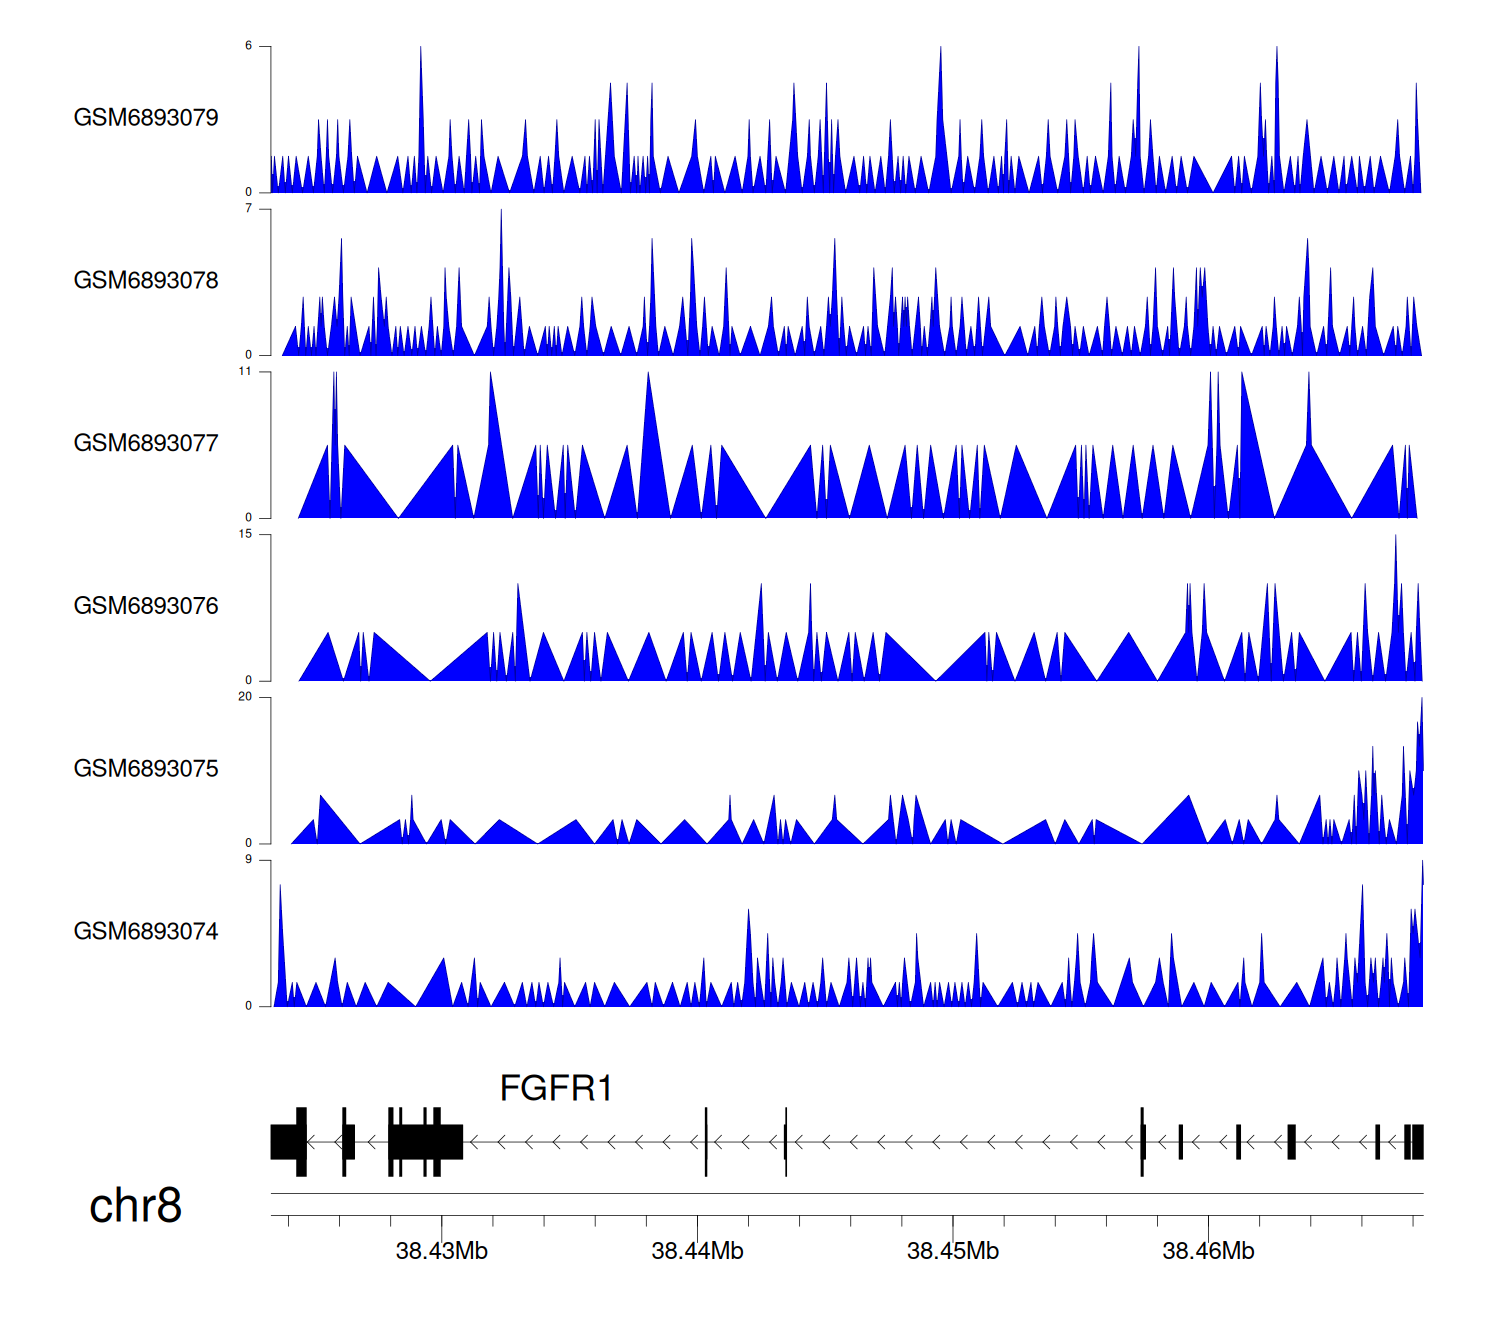
|
> Dataset: GSE165705 - FGFR1 peak across samples
|
Peak Plot
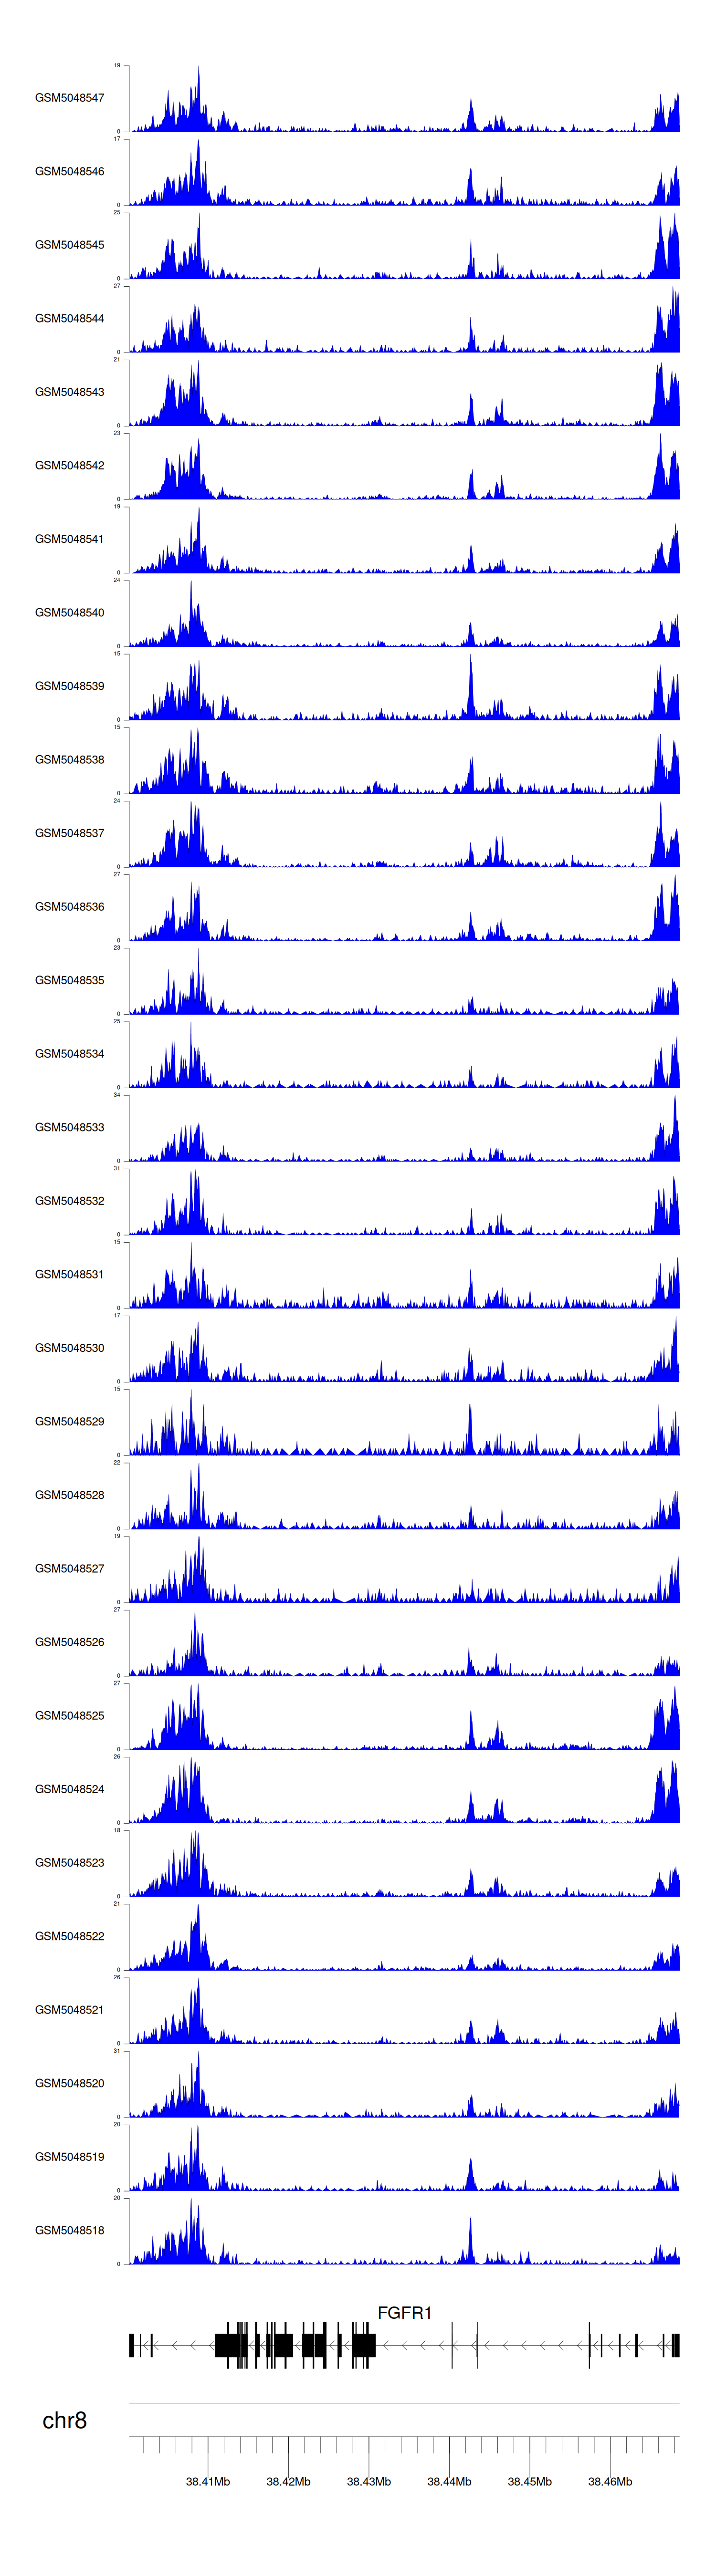
|
> Dataset: GSE144329 - FGFR1 peak across samples
|
Peak Plot

|
> Dataset: GSE220859 - FGFR1 peak across samples
|
Peak Plot
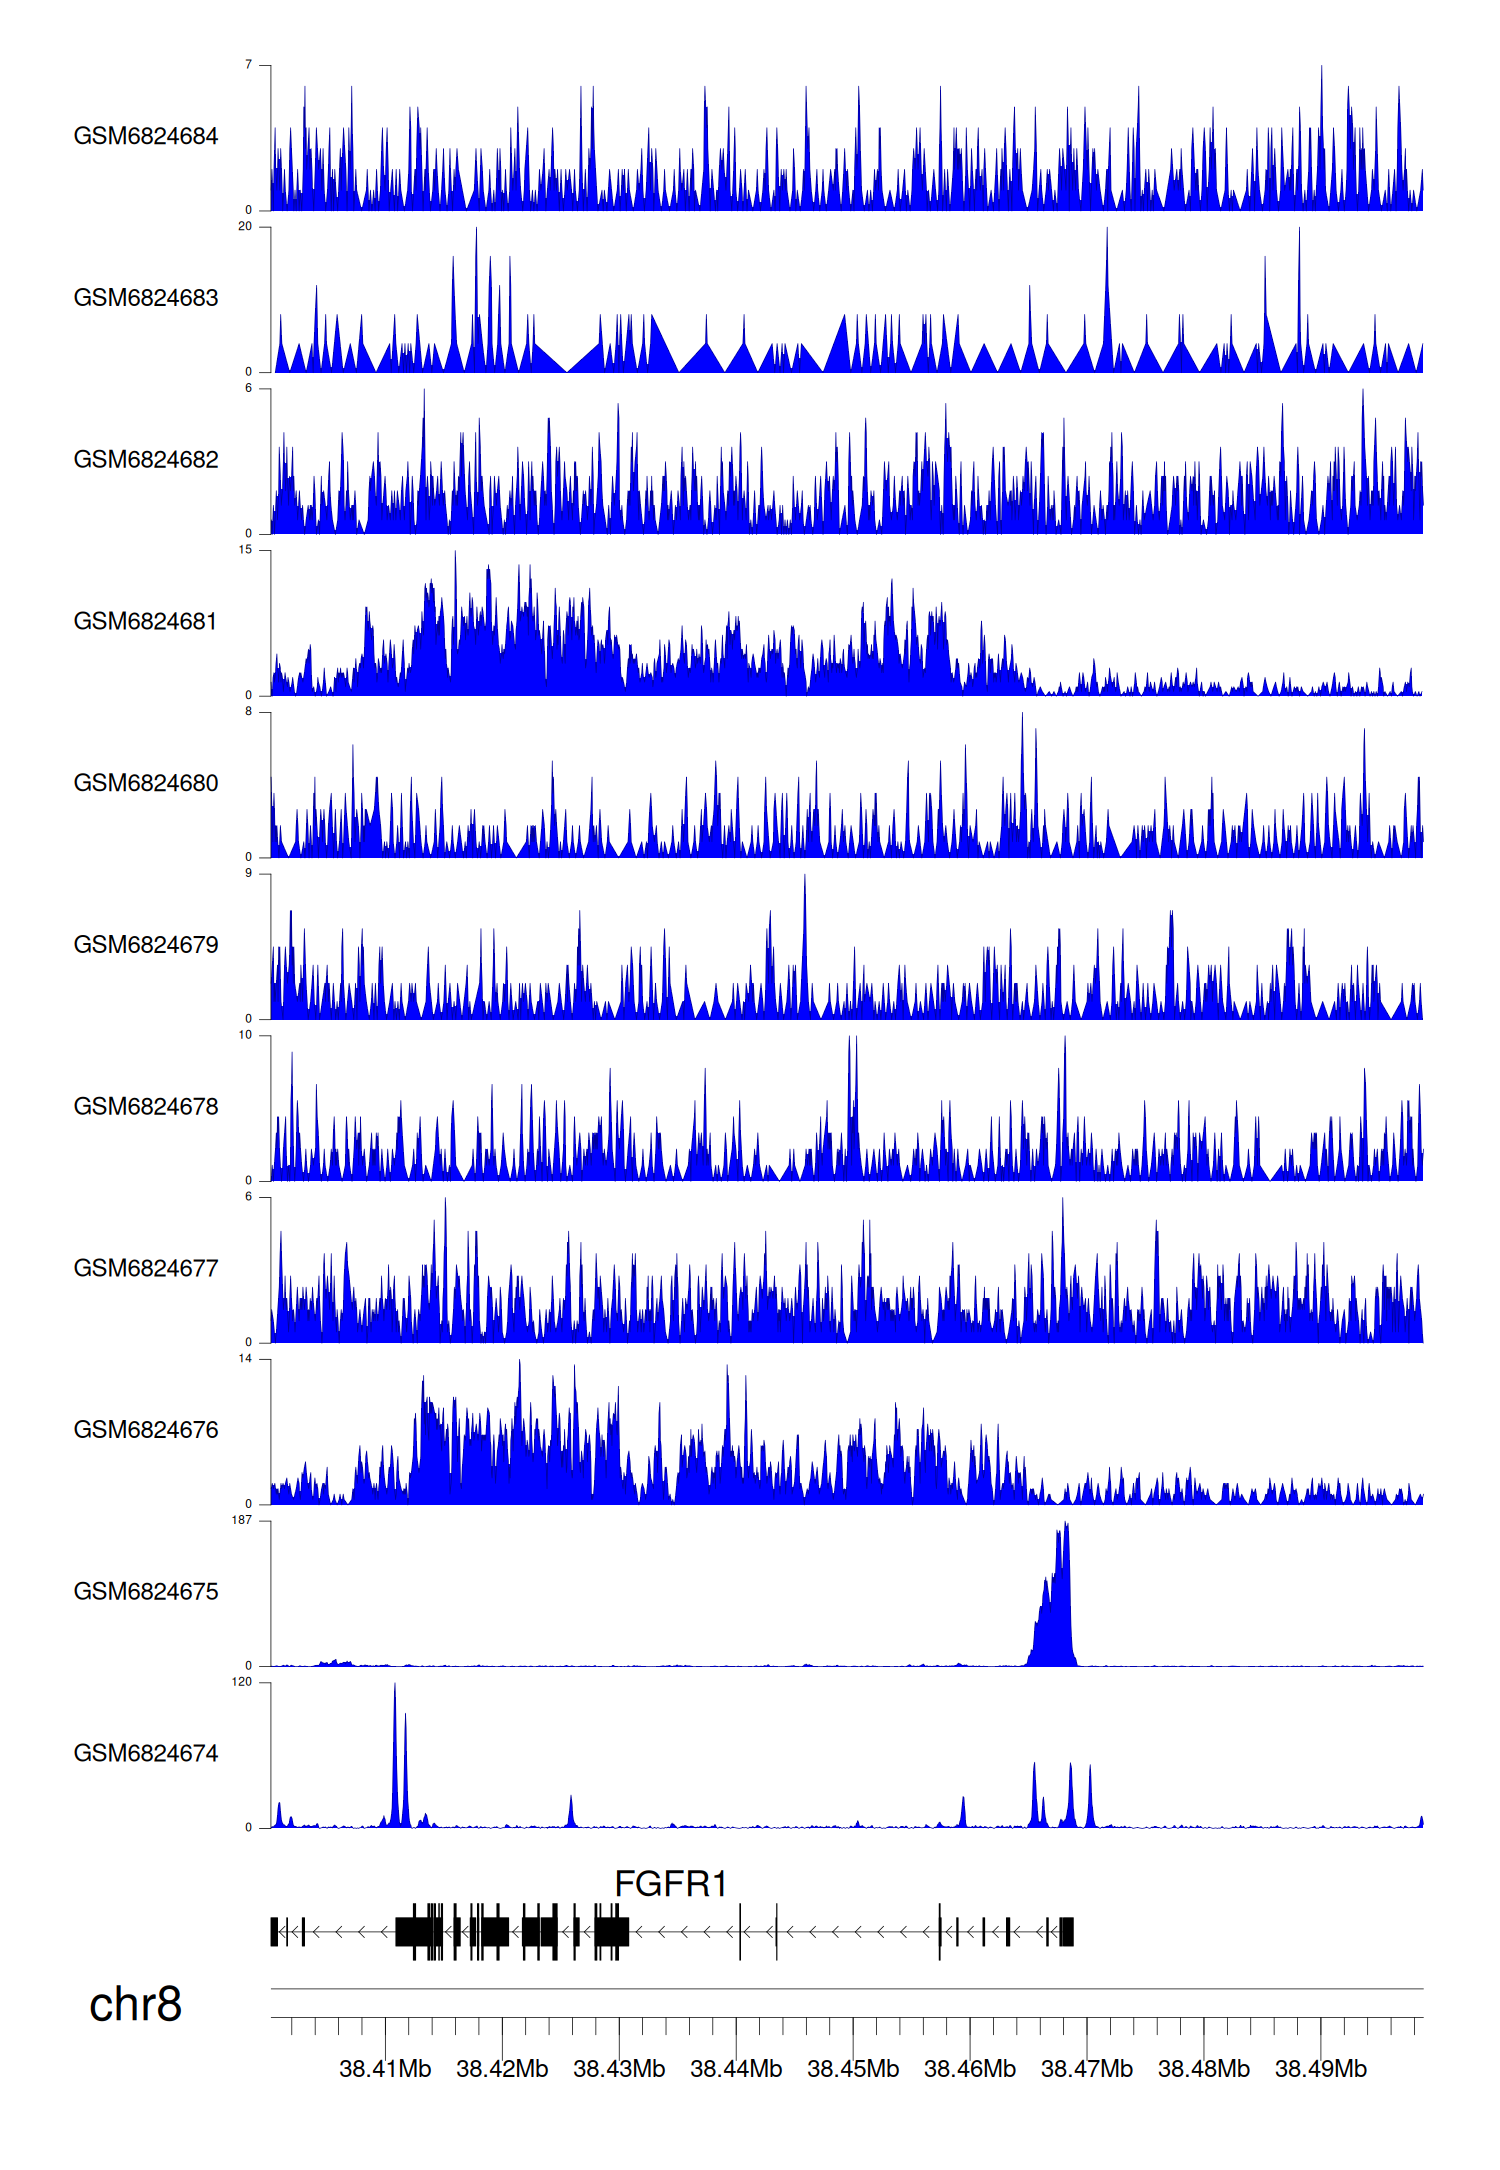
|
> Dataset: GSE211651 - FGFR1 peak across samples
|
Peak Plot
|
> Dataset: GSE100376 - FGFR1 peak across samples
|
Peak Plot
|
> Dataset: GSE100266 - FGFR1 peak across samples
|
Peak Plot
|
> Dataset: GSE165703 - FGFR1 peak across samples
|
Peak Plot
|
|
|
