Gene Information
|
Gene Name
|
MPL |
|
Gene ID
|
4352
|
|
Gene Full Name
|
MPL proto-oncogene, thrombopoietin receptor |
|
Gene Alias
|
C-MPL|CD110|MPLV|THCYT2|THPOR|TPOR |
|
Transcripts
|
ENSG00000117400
|
|
Virus
|
HIV |
|
Gene Type
|
protein-coding |
|
HPA Location Info
|
Plasma membrane;Nuclear membrane; 
|
|
Membrane Info
|
Cancer-related genes, CD markers, Disease related genes, FDA approved drug targets, Human disease related genes, Predicted intracellular proteins, Predicted membrane proteins |
|
Uniport_ID
|
P40238
|
|
HGNC ID
|
HGNC:7217
|
|
OMIM ID
|
159530 |
|
Summary
|
In 1990 an oncogene, v-mpl, was identified from the murine myeloproliferative leukemia virus that was capable of immortalizing bone marrow hematopoietic cells from different lineages. In 1992 the human homologue, named, c-mpl, was cloned. Sequence data revealed that c-mpl encoded a protein that was homologous with members of the hematopoietic receptor superfamily. Presence of anti-sense oligodeoxynucleotides of c-mpl inhibited megakaryocyte colony formation. The ligand for c-mpl, thrombopoietin, was cloned in 1994. Thrombopoietin was shown to be the major regulator of megakaryocytopoiesis and platelet formation. The protein encoded by the c-mpl gene, CD110, is a 635 amino acid transmembrane domain, with two extracellular cytokine receptor domains and two intracellular cytokine receptor box motifs . TPO-R deficient mice were severely thrombocytopenic, emphasizing the important role of CD110 and thrombopoietin in megakaryocyte and platelet formation. Upon binding of thrombopoietin CD110 is dimerized and the JAK family of non-receptor tyrosine kinases, as well as the STAT family, the MAPK family, the adaptor protein Shc and the receptors themselves become tyrosine phosphorylated. [provided by RefSeq, Jul 2008] |
Target gene [MPL] related to VISs 
Integration Table: if previous studies reported that target gene was altered by virus integration events, the overlap between VISs in this literature and Cistrome factors was listed in this section
| DVID |
Chromosome |
HM |
TFBS |
CA |
Sum of Overlapped Records |
Detail |
| 4000653 |
chr1 |
5 |
230 |
96 |
331 |
View |
Target gene [MPL] related to Omics data
| Data ID |
Experiment type |
Sample number |
Platform |
|
C GSE221688
|
Chip-seq;scATAC-Seq;scRNA-Seq |
12 |
Illumina NovaSeq 6000 (Homo sapiens) |
|
GSE99737
|
RNA-seq |
9 |
Illumina HiSeq 2500 (Homo sapiens) |
|
GSE144332
|
RNA-seq |
75 |
NextSeq 550 (Homo sapiens) |
|
C GSE165705
|
Chip-seq |
30 |
Illumina NovaSeq 6000 (Homo sapiens) |
|
GSE164264
|
RNA-seq |
6 |
BGISEQ-500 (Homo sapiens) |
|
C GSE30738
|
Chip-seq |
2 |
Illumina Genome Analyzer II (Homo sapiens) |
|
GSE262621
|
RNA-seq |
70 |
Illumina NovaSeq 6000 (Homo sapiens) |
|
GSE128121
|
RNA-seq |
16 |
Illumina HiSeq 4000 (Homo sapiens) |
|
GSE162914
|
RNA-seq |
211 |
Illumina HiSeq 2500 (Homo sapiens) |
|
GSE279982
|
Methylation profiling (Array) |
576 |
Infinium MethylationEPIC |
|
C GSE144329
|
ATAC-seq |
96 |
NextSeq 550 (Homo sapiens) |
|
GSE205204
|
RNA-seq |
14 |
Illumina NovaSeq 6000 (Homo sapiens) |
|
GSE125686
|
RNA-seq |
62 |
Illumina HiSeq 2000 (Homo sapiens);Illumina HiSeq 2500 (Homo sapiens);Illumina NextSeq 500 (Homo sapiens) |
|
GSE233747
|
scRNA-seq |
40 |
Illumina NovaSeq 6000 (Homo sapiens) |
|
C GSE220859
|
Chip-seq |
11 |
Illumina NovaSeq 6000 (Homo sapiens) |
|
GSE165708
|
RNA-seq |
100 |
Illumina HiSeq 4000 (Homo sapiens) |
|
C GSE211651
|
Chip-seq;RNA-seq;PRO-seq |
39 |
Illumina NextSeq 500 (Homo sapiens);Illumina NovaSeq 6000 (Homo sapiens) |
|
GSE68028
|
MeDIP-chip |
1 |
NimbleGen Human DNA Methylation 2.1M Deluxe Promoter Array [100929_HG19_Deluxe_Prom_Meth_HX1] |
|
C GSE100376
|
ATAC-seq |
24 |
Illumina NextSeq 500 (Homo sapiens) |
|
GSE167211
|
RNA-seq |
1 |
Illumina HiSeq 2000 (Homo sapiens) |
|
GSE165132
|
RNA-seq |
56 |
NextSeq 550 (Homo sapiens) |
|
C GSE100266
|
ATAC-seq;Chip-seq;RNA-seq |
32 |
Illumina HiSeq 2500 (Homo sapiens) |
|
C GSE165703
|
ATAC-seq |
82 |
Illumina HiSeq 4000 (Homo sapiens) |
|
GSE246082
|
RNA-seq |
6 |
Illumina HiSeq 4000 (Homo sapiens) |
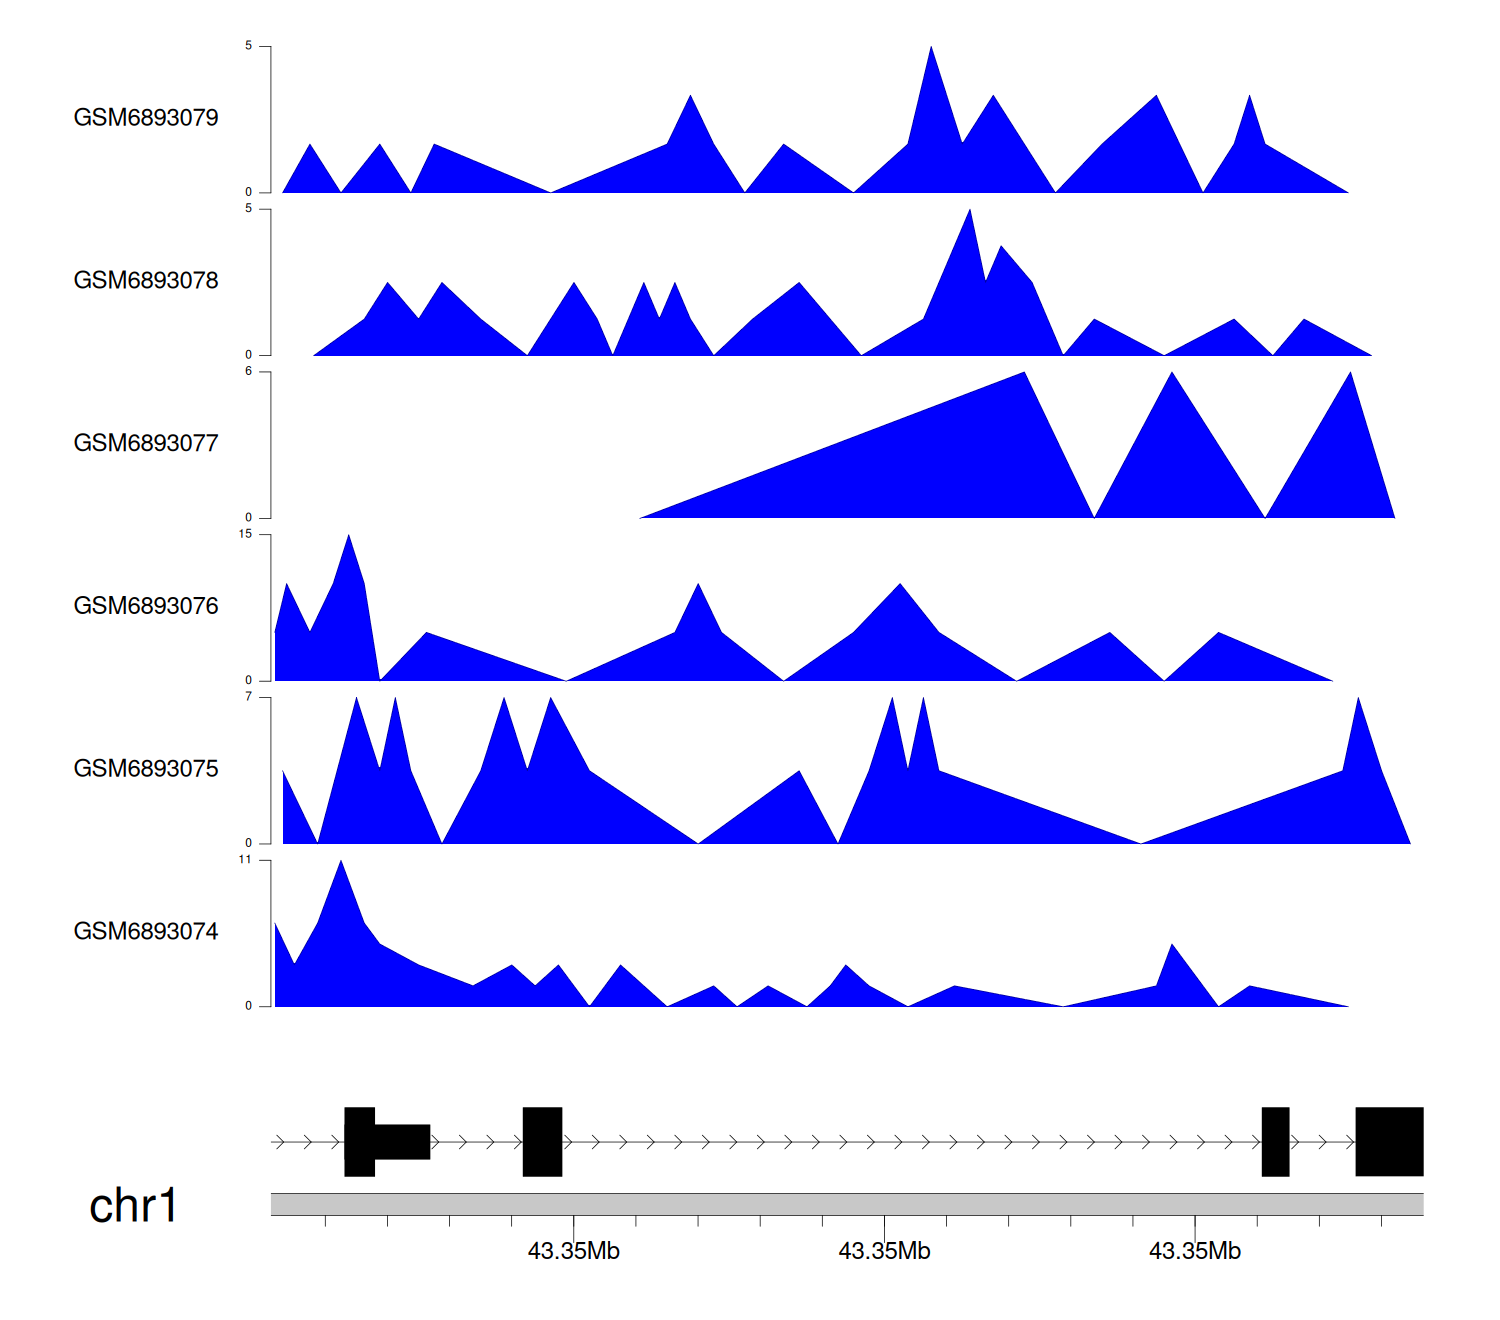
When the gene can detect a peak in the dataset, a peak plot will be displayed.
> Dataset: GSE221688 - MPL peak across samples
|
Peak Plot
|
> Dataset: GSE165705 - MPL peak across samples
|
Peak Plot
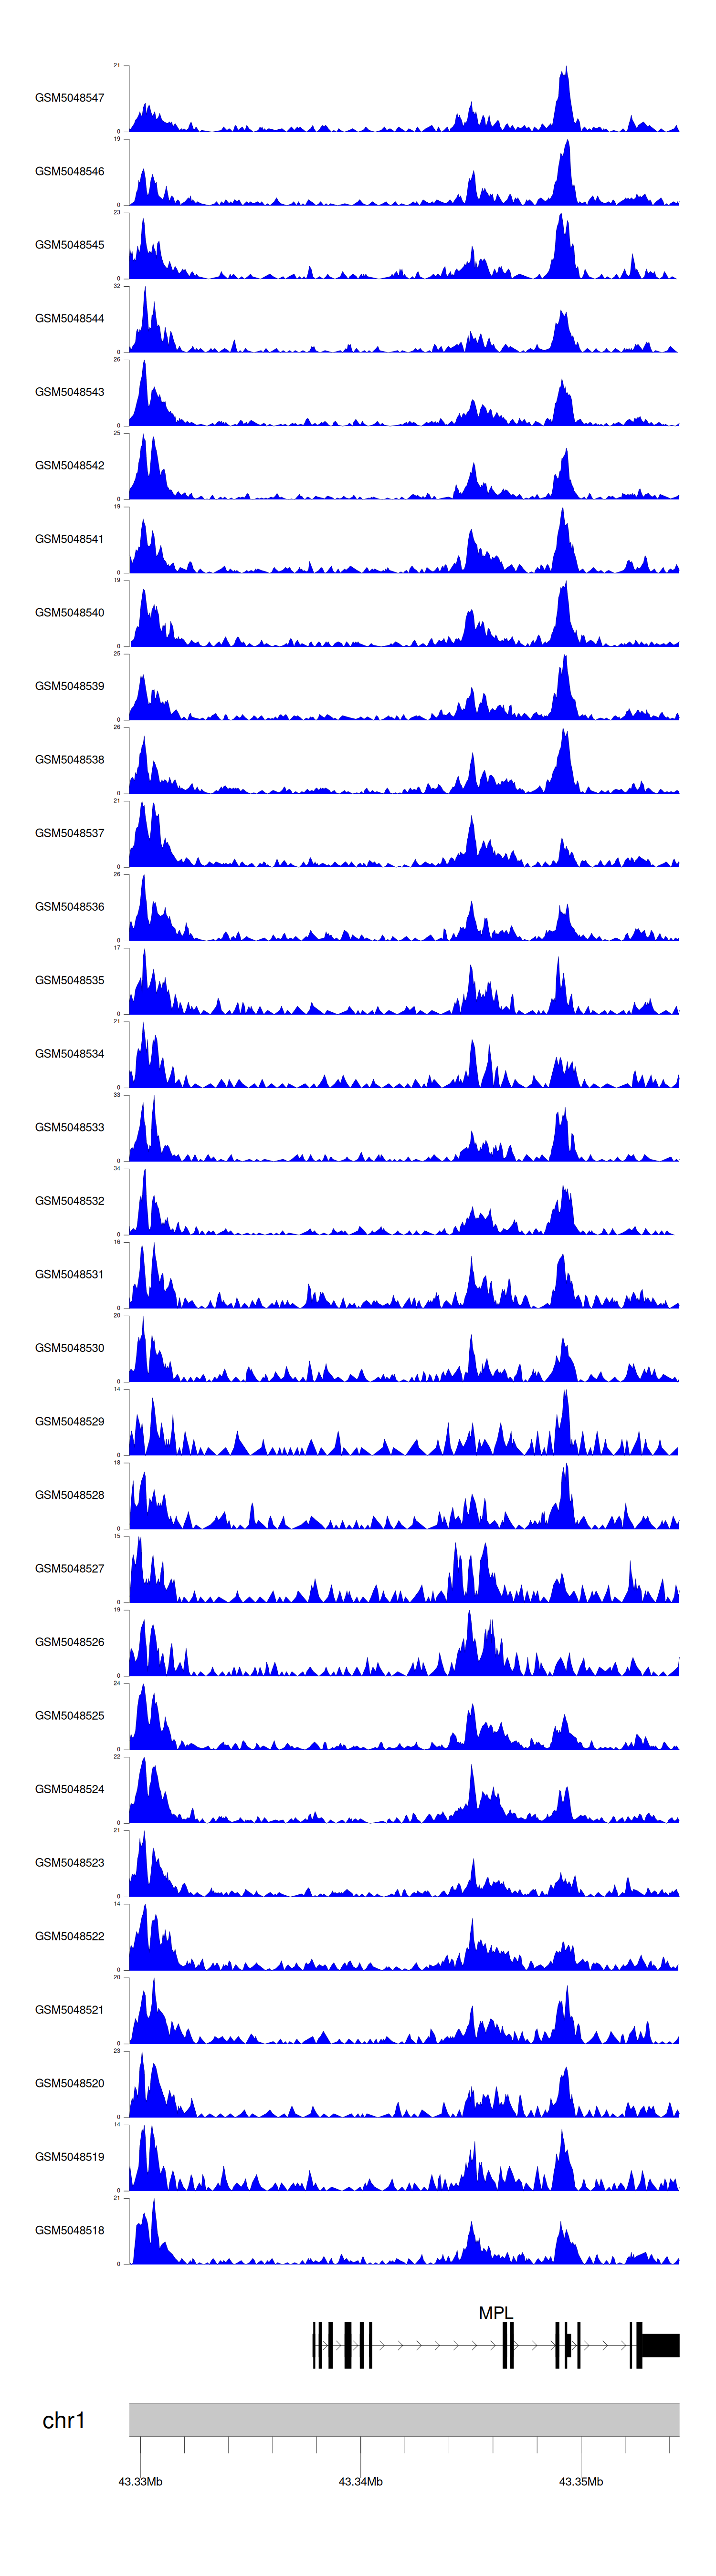
|
> Dataset: GSE30738 - MPL peak across samples
|
Peak Plot
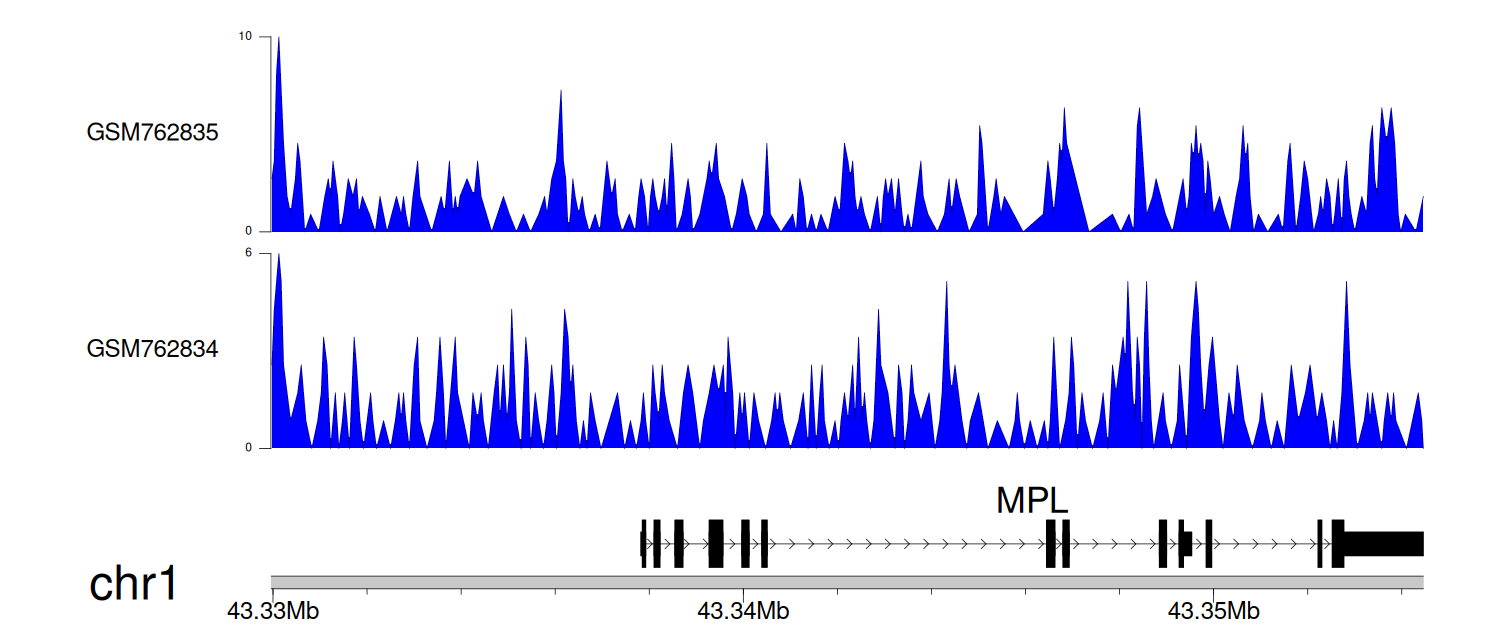
|
> Dataset: GSE144329 - MPL peak across samples
|
Peak Plot

|
> Dataset: GSE220859 - MPL peak across samples
|
Peak Plot
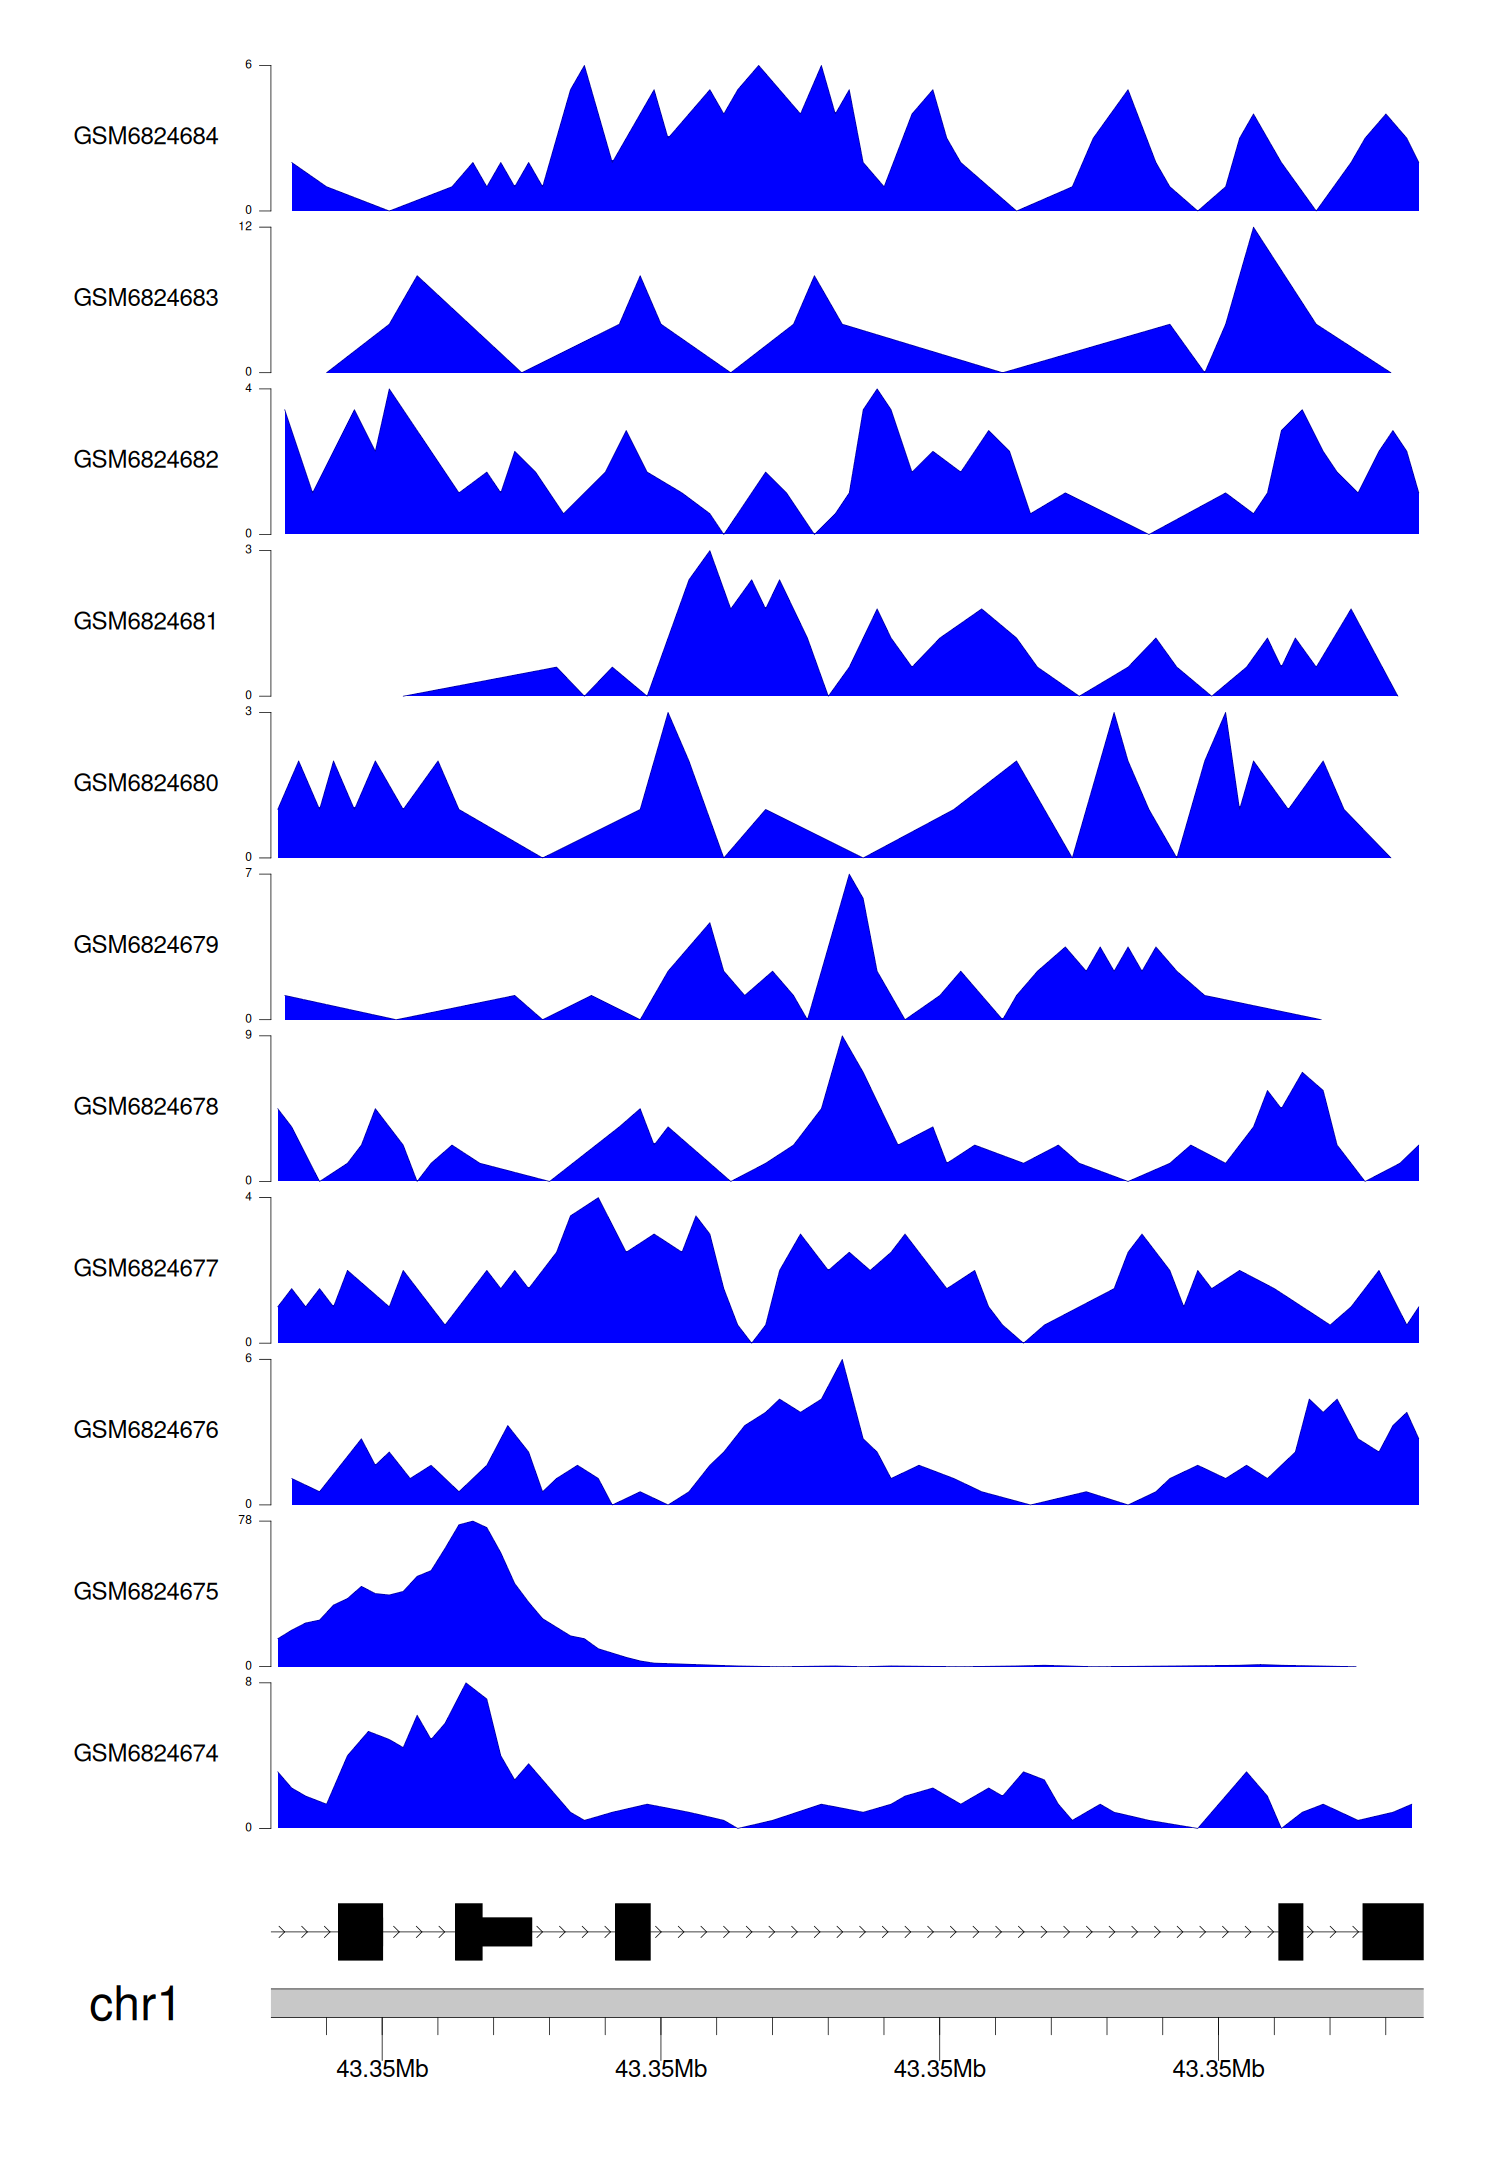
|
> Dataset: GSE211651 - MPL peak across samples
|
Peak Plot
|
> Dataset: GSE100376 - MPL peak across samples
|
Peak Plot
|
> Dataset: GSE100266 - MPL peak across samples
|
Peak Plot
|
> Dataset: GSE165703 - MPL peak across samples
|
Peak Plot
|
|
|
